No results found

We're sorry, but there are no results that match your search criteria. Try checking your spelling or using alternate search terms.

We add new data to USAFacts all the time; you can subscribe to our newsletter to get unbiased, data-driven insights sent to your inbox weekly, no searching required.

Subscribe to get unbiased, data-driven insights sent to your inbox weekly.

Topics

Subscribe to get unbiased, data-driven insights sent to your inbox weekly.

Employees > Item 1 - Purpose and Function of Our Government - General > PART I > 2021 Government 10-K

Employees

Published on Mon, May 17, 2021 9:00AM PDT | Updated Mon, May 17, 2021 9:11AM PDT

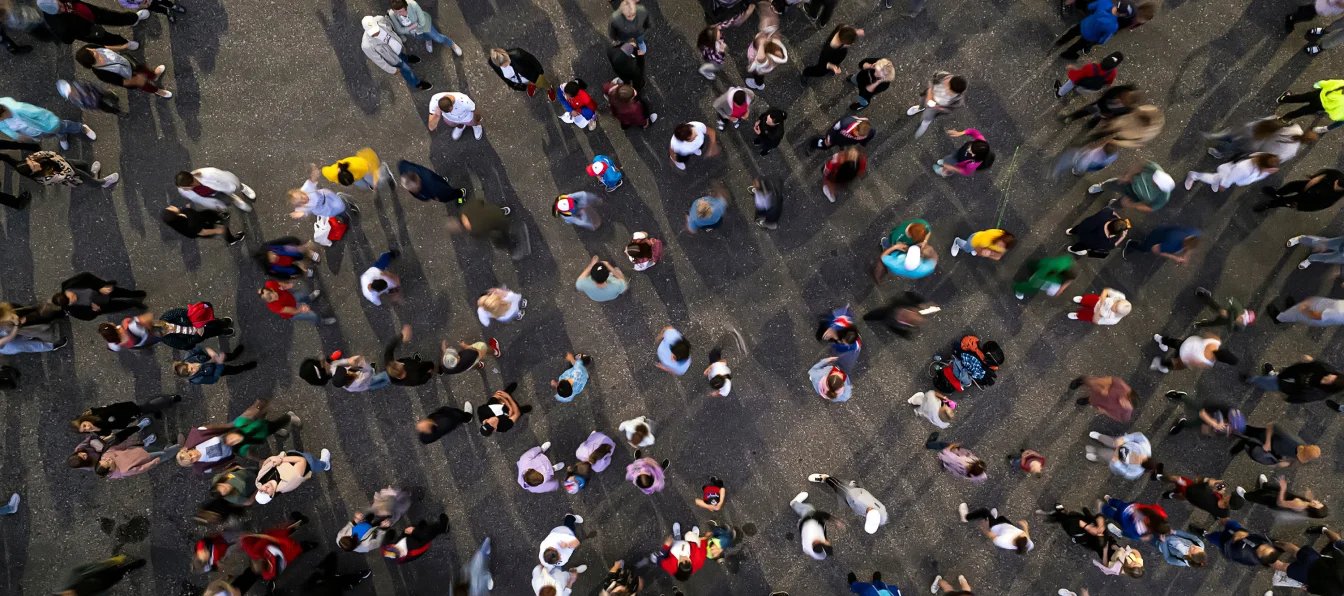
As of the dates shown below, there were 23.7 million full-time and part-time employees of our Government, including:

  • 4.0 million federal employees, of whom 8% (excluding armed forces) work part-time;
  • 5.5 million state employees, of whom 29% work part-time; and
  • 14.2 million local government employees, of whom 23% work part-time.

The functions of our Government employing the most people and the respective percentage of Government employees were:

  • Education – 47%, of which 69% relate to elementary and secondary education, 30% relate to higher education, and 1% relate to other education;
  • Active duty military – 6%;
  • Hospitals – 6%; and
  • Police – 5%.

Employees by segment and reporting unit (to the extent allocable) were as follows:

March

Total

State and Local

2019

Federal

2014 4


All government employees (part-time and full-time)

23,727,154

19,688,199

4,038,955

Establish Justice and Ensure Domestic Tranquility

2,895,512

2,610,273

285,239

Police protection

1,185,942

1,000,312

185,630

Fire protection

450,073

450,073

Corrections

755,724

716,713

39,011

Judicial and legal

503,773

443,175

60,598


Provide for the Common Defense

2,082,300

2,082,300

National defense and international relations 1

743,813

743,813

Active duty military 2

1,338,487

1,338,487


Promote the General Welfare

4,753,590

3,687,163

1,066,427

Highways

509,287

506,404

2,883

Transit

268,093

268,093

Air transportation

99,550

54,487

45,063

Water transport and terminals

18,611

14,118

4,493

Space research and technology

17,736

17,736

Public welfare

554,009

544,322

9,687

Housing and community development

123,009

110,782

12,227

Health

656,289

487,159

169,130

Hospitals

1,327,406

1,100,691

226,715

Social insurance administration (state and local) 3

66,396

66,396

Solid waste management

113,578

113,578

Sewerage

131,169

131,169

Water supply

187,504

187,504

Electric power

78,254

78,254

Gas supply

11,578

11,578

Postal service

578,493

578,493

State liquor stores

12,628

12,628


Secure the Blessings of Liberty to Ourselves and Our Posterity

12,299,936

12,028,433

271,503

Education

11,232,173

11,222,799

9,374

Libraries

186,642

183,262

3,380

Parks and Recreation

454,539

432,185

24,354

Social Insurance Administration (federal) 3

62,708

62,708

Natural Resources

361,874

190,187

171,687


General Government and Other

1,695,816

1,362,330

333,486

Financial administration

572,273

455,122

117,151

Other government administration

441,964

417,829

24,135

All other and unallocable

681,579

489,379

192,200


Sources: US Census Bureau, Bureau of Economic Analysis

†† We limited the data in this table to the years presented to provide the most recent data but to also fit the table to the page. Additional years of data and more detail may be found on our website. Click “More detail” to access it.

1 Civilian military employees are included in national defense and international relations.

2 Active duty military are as of September of each year, reserves are not included.

3 At the federal level, social insurance administration employees are primarily those responsible for administering Social Security and Medicare and therefore have been allocated to “Secure the Blessings of Liberty to Ourselves and Our Posterity.” State and local social insurance administration employees administer unemployment and job services and therefore are allocated to “Promote the General Welfare.”

4 Federal employees are as of March of 2014, the latest date available.

For 2020, 38% of government employees were represented by unions, including 30% of federal government employees, 34% of state government employees, and 45% of local government employees.30

Talented employees are critical to the success of our Government, and the market for talented employees is competitive. The Government Accountability Office has found that mission-critical skills gaps within the federal workforce pose a high risk to the nation. Regardless of whether the shortfalls are in such government-wide occupations as cybersecurity and acquisitions, or in agency-specific occupations such as nurses at the Veterans Health Administration (VHA), skills gaps impede the federal government from cost-effectively serving the public and achieving results. Agencies can have skills gaps for different reasons: they may have an insufficient number of people or their people may not have the appropriate skills or abilities to accomplish mission-critical work. Moreover, current budget and long-term fiscal pressures, the changing nature of federal work, and a potential wave of employee retirements that could produce gaps in leadership and institutional knowledge, threaten to aggravate the problems created by existing skills gaps. Indeed, the government’s capacity to address complex challenges such as disaster response, national and homeland security, and rapidly-evolving technology and privacy security issues requires a skilled federal workforce able to work seamlessly with other agencies, with other levels of government, and across sectors.31