What is the crime rate in the US?
Refreshed annually
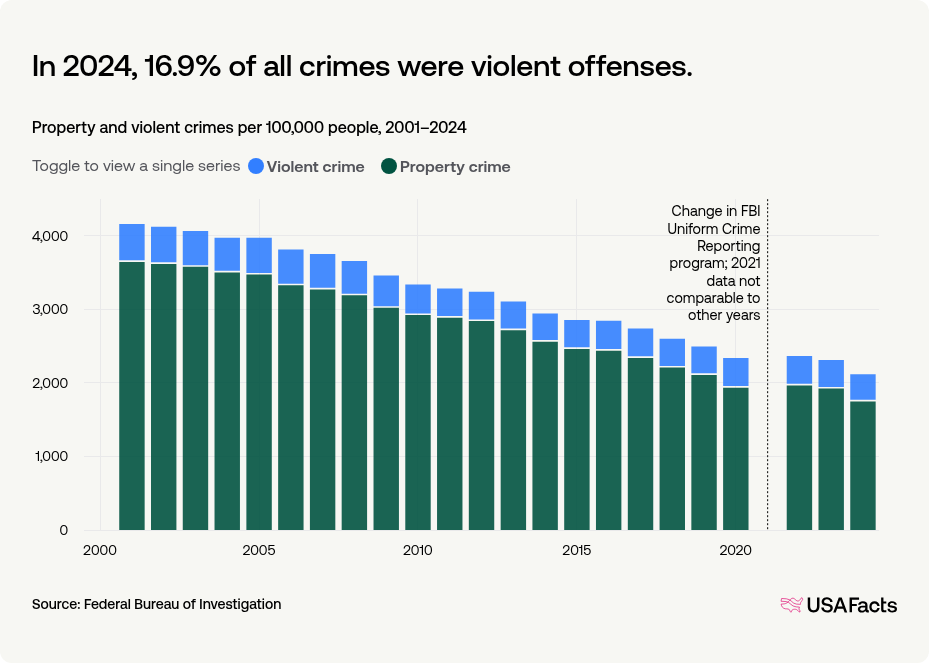
In 2024, for every 100,000 people, the violent crime rate was 359 and the property crime rate was 1,760. Simply speaking, violent crimes are committed against people, property crimes are not. These crime rates do not include every violent and property crime, but rather four violent offenses and three property offenses that have been tracked since 1929.
359
violent crimes per 100K people (2024)
1,760
property crimes per 100K people (2024)
The combined violent and property crime rate in the US fell 8.4% versus the previous year, driven by a 5.4% decrease in the violent crime rate and a 9% decrease in the property crime rate. Since 2001, that overall crime rate is down 49.1%.
In 2024, 16.9% of all crimes were violent offenses.
Property and violent crimes per 100,000 people, 2001–2024
What is violent crime? Has it increased or decreased over time?
Violent crimes involve force or the threat of force, and include:
- Murder and non-negligent manslaughter
- Rape
- Robbery (the FBI defines this as “... taking or attempting to take something of value from a victim ... by the use of force or threat of force ...”; the victim must be present).
- Aggravated assault
Get weekly insights
Subscribe for data-driven insights. No spin, just the facts.
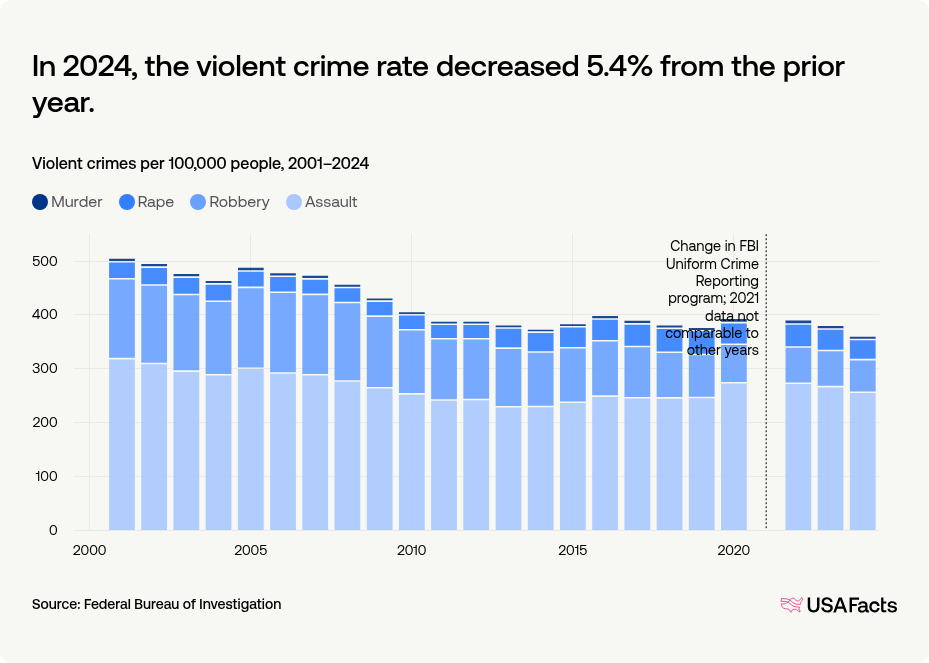
In 2024, there was about one violent offense for every 278 people. 71.3% of all violent crimes were aggravated assaults; 16.9%, robberies; 10.4%, rapes; and 1.4%, murders.
In 2024, the violent crime rate decreased 5.4% from the prior year.
Violent crimes per 100,000 people, 2001–2024
What is property crime? Has it increased or decreased over time?
Property crimes involve the taking of money or property without force or the threat of it, and include:
- Burglary (the FBI defines this as “the unlawful entry into a building or some other structure to commit a felony or a theft”).
- Larceny-theft, often called stealing (the FBI defines this as “the unlawful taking, carrying, leading, or riding away of property from the possession or constructive possession of another person”).
- Motor vehicle theft (not included in larceny-theft)
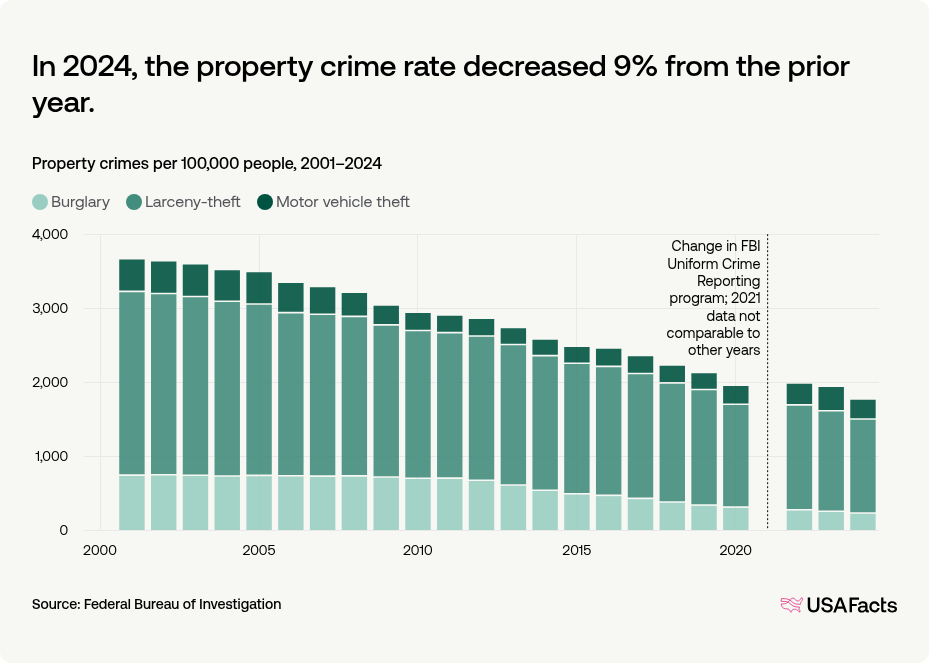
In 2024, there was about one property crime for every 57 people. 72.3% of all property crimes were larceny-thefts; 14.7%, motor vehicle thefts; and 13%, burglaries.
In 2024, the property crime rate decreased 9% from the prior year.
Property crimes per 100,000 people, 2001–2024
What state has the highest crime rate? What state has the lowest?
In 2024, the highest and lowest violent crime rates among states were in Alaska at 724 offenses per 100,000 people and Maine at 100. The highest property crime rate was in New Mexico at 2,751 per 100,000 while the lowest was in Idaho at 736.
Washington, DC is also factored into the country’s overall crime rate. It had a violent crime rate of 1,006 offenses per 100,000 and a property crime rate of 3,693.
Among states, Alaska had the highest violent crime rate and New Mexico had the highest property crime rate.
Property and violent crimes per 100,000 people, 2024

Crime rate per 100,000 people, by state (2024)
| 1. | Washington, DC | 1,006 |
| 2. | Alaska | 724 |
| 3. | New Mexico | 717 |
| 4. | Tennessee | 592 |
| 5. | Arkansas | 579 |
| 6. | Louisiana | 520 |
| 7. | California | 486 |
| 8. | Colorado | 476 |
| 9. | Missouri | 462 |
| 10. | Kansas | 439 |
Keep exploring
Methodology
USAFacts standardizes data, in areas such as time and demographics, to make it easier to understand and compare.
Page sources
USAFacts endeavors to share the most up-to-date information available. We sourced the data on this page directly from government agencies; however, the intervals at which agencies publish updated data vary.