How many people receive government assistance?
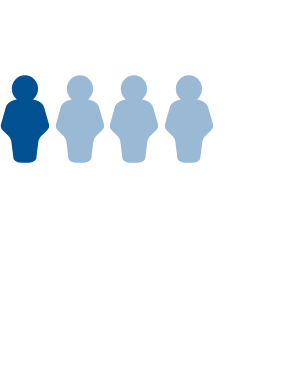
In 2022, around one in three Americans was enrolled in at least one government assistance program.
Nearly 100 million Americans received some form of government assistance in 2019, according to a 2023 estimate from the Department of Health and Human Services (HHS).
The federal government has assistance programs in place to support Americans who can’t afford food, housing, healthcare, and other needs. This is sometimes referred to as a social safety net, a system of programs designed to support people struggling economically. In 2022, around one in three Americans was enrolled in at least one of those programs, including nearly half of all American kids.
What government assistance programs are available?
Government assistance programs each have eligibility requirements, which may include income level, family situation, age, and disability status. Some examples of these programs include:
- The Medicaid and the Children’s Health Insurance Program (CHIP), which provides health insurance for free or at a reduced cost
- Social Security for people of retirement age, people with disabilities, and survivors of family losses, including spouses and children
- Medicare, a public health insurance program for people who are 65 and older or have certain disabilities
- The Supplemental Nutrition Assistance Program (SNAP), also called “food stamps,” which offers food benefits
- The Special Supplemental Nutrition Program for Women, Infants, and Children (WIC), which offers nutritional support to mothers, children, and pregnant women
- The National School Lunch Program (NSLP) which offers free or reduced-price lunches to students
- Supplemental Security Income (SSI), which provides monthly payments to low-income people
- Temporary Assistance for Needy Families (TANF), sometimes called welfare, which supports low-income families with monthly cash payments
- The Low Income Home Energy Assistance Program (LIHEAP), which subsidizes heating and cooling bills
- Rental assistance programs including Section 8 housing
- Unemployment insurance for people who have lost jobs
Which government assistance programs have the highest enrollment?
The largest programs by total enrollment are Medicaid, Medicare, and Social Security. In 2022, nearly one in four Americans received Medicaid, while Medicare and Social Security each covered around one in five. SNAP followed, offering benefits to 11.7% of Americans.
These programs support different populations, based on eligibility. Medicare covered 93.2% of people 65 and older, and Social Security covered 84.3%. The National School Lunch Program provided free or reduced-price lunches to 38.7% of the country’s children, equivalent to 8.8% of Americans.
Many beneficiaries of government assistance programs receive benefits from multiple sources at once. Around five out of every six Medicare beneficiaries also receive Social Security, and vice versa. Nearly 80% of SNAP recipients are also covered by Medicaid or CHIP.
Learn more about poverty in the US, government spending on assistance programs,, and get the data directly in your inbox by subscribing to our weekly newsletter.
