US obesity rates have tripled over the last 60 years
Nationwide surveys show that 40% of Americans are obese, while 10% are severely obese.
According to National Institutes of Health surveys conducted since the early 1960s, US obesity rates have tripled over the last 60 years. The number of people classified with severe obesity has risen tenfold.
How is obesity measured?
A person’s weight class can range from underweight to obese and is calculated with a screening tool called the Body Mass Index (BMI). BMI is calculated by dividing someone’s weight (in kilograms) by their height (in meters) and a common stand-in for body fat measurement in children and adults, although it doesn’t distinguish between fat, muscle, and bone mass.
Severe obesity is a sub-class within the obesity category.
How have obesity rates changed over time?
In the early 1960s, roughly 13% of people were considered obese under Centers for Disease Control and Prevention (CDC) guidelines. Recent figures suggest that the current national obesity rate is closer to 40%.
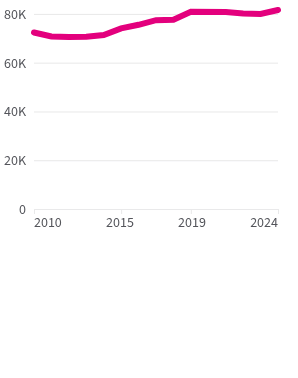
Almost 10% of Americans were categorized as severely obese during the 2021–2023 survey, compared to fewer than 1% in 1960–1962. Childhood obesity rates also rose, tripling from 5% in the early 1970s to over 21% by 2021–2023.
Nationwide obesity rates have more than tripled since the 1960s.
Age-adjusted nationwide obesity and severe obesity rates, 1960–2023

Obesity rates vary across demographics and states and tend to be higher for certain racial/ethnic groups and among people in lower income brackets.
Get weekly insights
Subscribe for data-driven insights. No spin, just the facts.
Which groups have higher obesity rates?
According to data from the Behavioral Risk Factor Surveillance System (BRFSS), lower-income Americans tended to have higher obesity rates than those living in high-income households.
In Maine, the obesity rate for people in households making $200,000+ was surveyed at 19.6%, compared to 45.5% for people in households making less than $15,000; this was the largest disparity in obesity rates by income bracket of any state.
Lower income Americans tend to have higher obesity rates.
Obesity rates by state and household income, 2023
But this trend isn’t clear-cut, and obesity rates by income bracket vary across states.
People in households with less than $15,000 in income had the highest surveyed obesity rates in 21 states. Those in households making between $25,000 and $34,999 had the highest rate in 12 other states. People earning $200,000 or more had the lowest rates in 43 states and Washington, DC.
But in Alaska and Georgia, obesity rates were highest for people in higher income brackets. In Alaska, the rate was highest in households earning $200,000+; in Georgia, the highest obesity rates were in households making between $100,000 and $199,000.
Although data is not always complete, rates also seem to be higher among certain racial and ethnic groups. Black, non-Hispanic people had the highest rates in 25 states, while American Indian/Alaska Native, non-Hispanic people had the highest obesity rates in 11 of the 28 states with data for that identity.
Native Hawaiian/other Pacific Islander had the highest obesity rate in each of the three states with data and Asian, non-Hispanic people had the lowest rate in each of the 22 states with data.
Obesity rates are higher among certain racial and ethnic groups.
Obesity rates by state and race/ethnicity, 2023
While the causes of differences between racial and ethnic groups are not known, the CDC suggests that underlying socioeconomic and environmental factors — lower high school graduation rates, higher unemployment rates, increased food insecurity, and more — may play a role.
Education may also influence obesity rates; people with at least a college degree had lower rates than people without. (The obesity rates of people who didn't graduate high school, did graduate high school but not college, and or had some college didn’t vary significantly.)
Note: These variables don’t indicate that certain groups of people are inherently more likely to be obese. The causes of obesity are complex and multi-faceted.
Which states have the highest overall obesity rates?
According to 2023 BRFSS data, West Virginia had the nation's highest obesity rate: 41.7% of its population. They were followed by Arkansas at 40.5%, and Mississippi at 40.4%.
Colorado had the lowest rate at 24.6%, followed by Hawaii at 26.8%, Massachusetts at 27.1%, and Washington, DC, at 24.2%.
In 2023, West Virginia, Arkansas, and Mississippi had obesity rates over 40%.
Age-adjusted obesity rates by state, 2023

Obesity rates grew in every state between 2013 and 2023. New Mexico had the largest change, rising from 26.3% in 2013 to 36.3% in 2023, an overall increase of 10.0 percentage points. Minnesota followed with an 8.1 point increase, then Alabama, Nebraska, and Oregon each with 7.4 points.
Obesity rates have risen in every state with data since 2013.
Net change in age-adjusted obesity rates by state between 2013 and 2023.

Regional obesity rates were highest in the Midwest and lowest in the Northeast.
How does obesity impact overall health?
The National Cancer Institute says that obese Americans are more at risk for certain cancers, including pancreatic, liver, and thyroid cancers.
Obesity has also been found to increase the risk of several other serious diseases and health conditions including type 2 diabetes and heart disease. According to the CDC, obesity-related medical care runs an estimated $173 billion a year.
The CDC reports that the top two primary drivers of preventable disease mortality are smoking and obesity, and notes that while reductions in smoking are driving declines in mortality, obesity trends are reversing those gains.
Why do obesity rates vary by so much?
We sourced obesity data from two standard CDC surveys: The Behavioral Risk Factor Surveillance System (BRFSS) and the National Health and Nutrition Examination Survey (NHANES). Both surveys are nationally representative, but only the BRFSS collects data on state trends.
BRFSS, started in 1984, is a telephone survey that asks Americans about various health-related topics, including height and weight. NHANES began in the early 1960s and is conducted by trained medical professionals.
It’s likely that BRFSS underestimates obesity rates, since medical professionals are more likely to collect accurate data; people who may feel stigmatized about their weight status are more likely to underreport. In 2023, BRFSS reported a national obesity rate for adults at 34.3%. The NHANES report from that same year calculates 40.3%.
Learn more about health in the US, including changing mortality, and get data directly in your inbox by signing up for our newsletter.
Keep exploring
- Are Americans meeting federal dietary guidelines? - A majority of people fall short of meeting recommendations outlined by the government — at least 35% of adults 18 and older were considered obese in 2021, according to the definitions of 21 states and territories.
- Why have death rates from accidental falls tripled? - Since 2000, death rates from heart disease and cancer have declined, whereas deaths from accidental falls have increased threefold.
- The state of healthcare at the end of 2020 - Americans — and their government — are paying more for health insurance at a time of uneven health risks across demographic groups and the COVID-19 pandemic.
- Semiquincentennial snapshot: the US at 250 years - Insights about the nation's population, households, education, employment, and income.
