How does America get its energy?
Wind, fossil fuel, solar: Get the facts on how America keeps its lights on. Plus, some good environmental news.
Up Next
Transcript
In this episode of Just the Facts: Energy and the Environment.
America consumes a lot of energy: with only 4% of the world's population, we account for about 16% of global energy use.
We use more energy than any other country except for China, but it spreads that energy use across the population nearly four times larger than ours.
The federal government and many state governments are passing laws and regulations designed to reduce our use of fossil fuels and increase renewable energy production.
So, what can we learn from the data?
Let's start with energy consumption. In 2023, America consumed 93.6 quadrillion British Thermal Units, or BTUs of energy.
A quadrillion is a huge number. It's a one followed by 15 zeros. It's a million billions.
A BTU measures the heat content of various fuel sources.
A single BTU is about equal to the energy released by burning a single match. There’s a BTU.
Now let's look at the energy the average American uses in our homes each year. About 63 million BTUs per person.
We use about half of this energy for heating and air conditioning. Another quarter is for lighting, refrigeration and hot water.
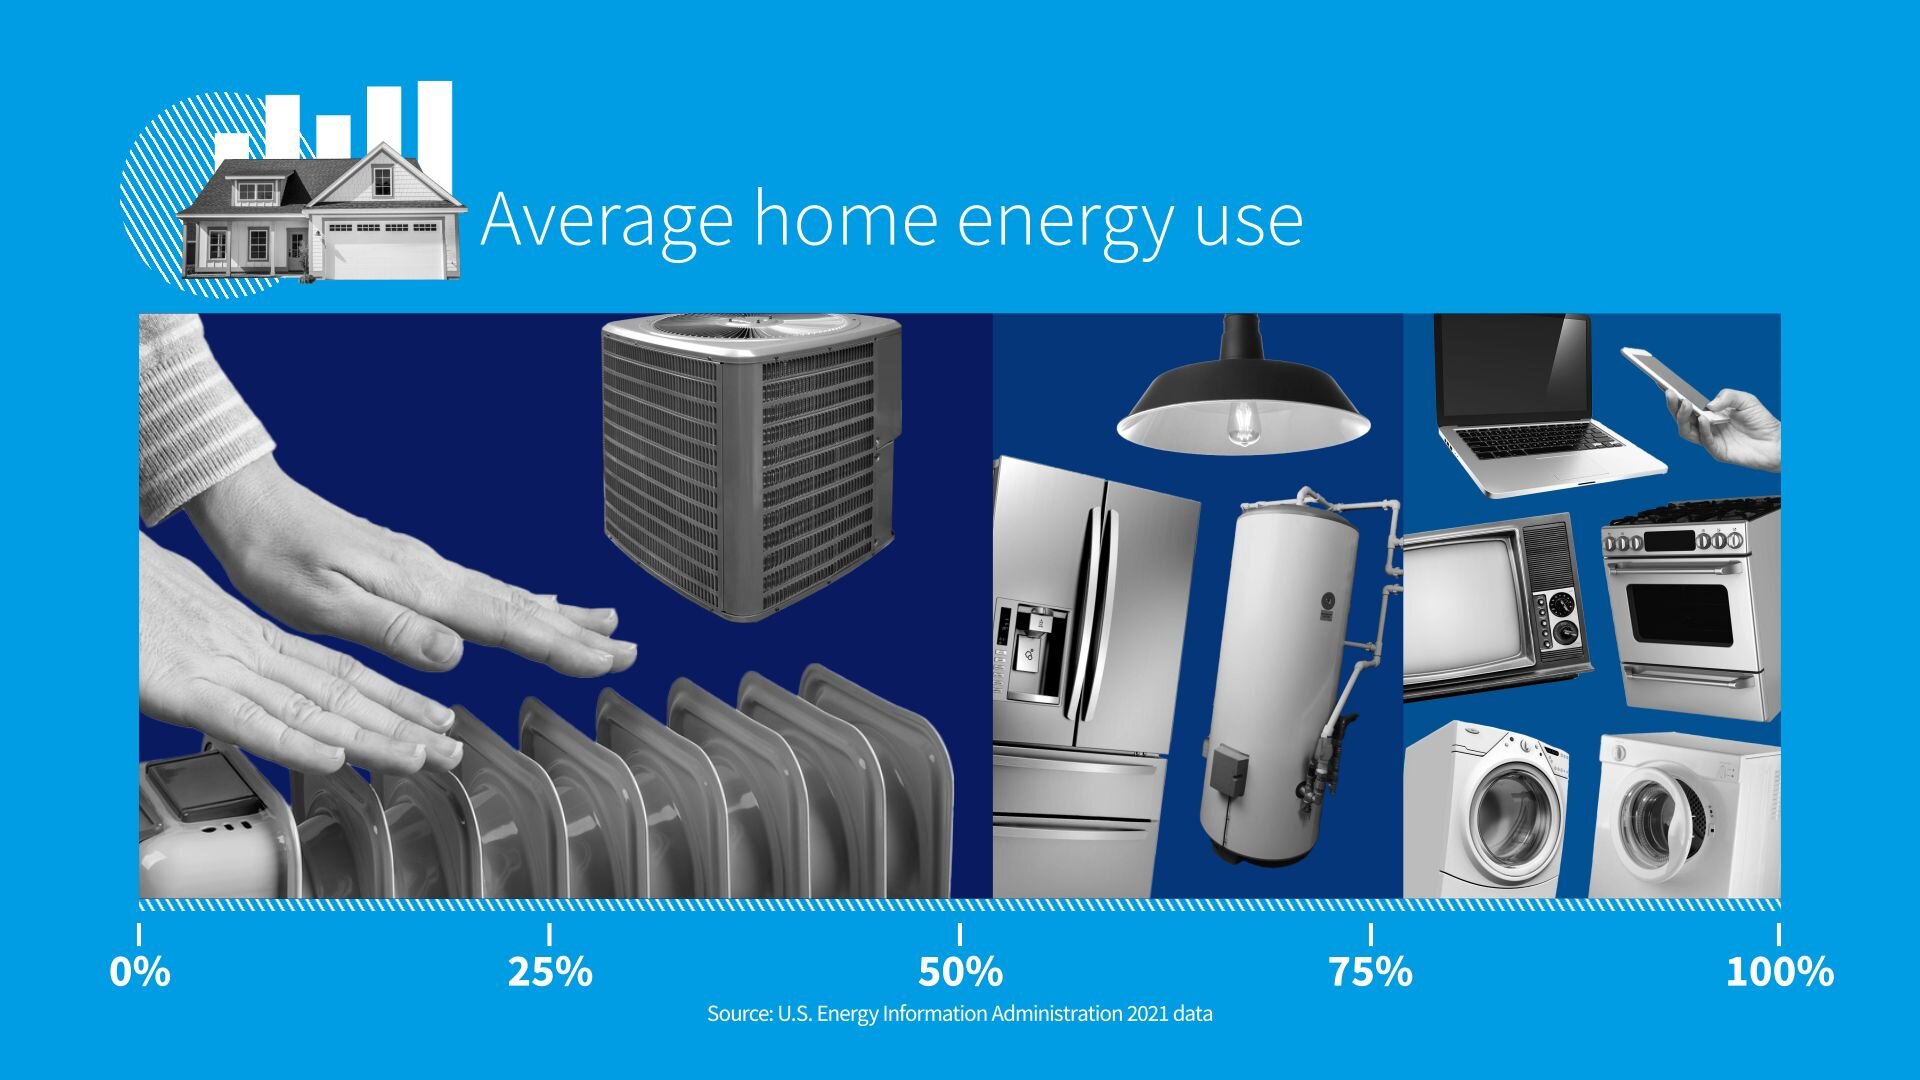
The rest is for powering major appliances like washers, dryers, televisions and stoves, as well as consumer electronics like phones and computers.
As for American electric bills, the retail price of electricity and average residential electric bills have stayed about the same over the last decade when adjusted for inflation.
For many people I encounter, the energy price they care about most is the price of gasoline, which costs $3.52 a gallon on average in 2023.
For perspective, since 1950 the lowest Americans ever paid for gas on an inflation adjusted basis was $1.98 in 1998.
The highest was $4.88 in 2012.
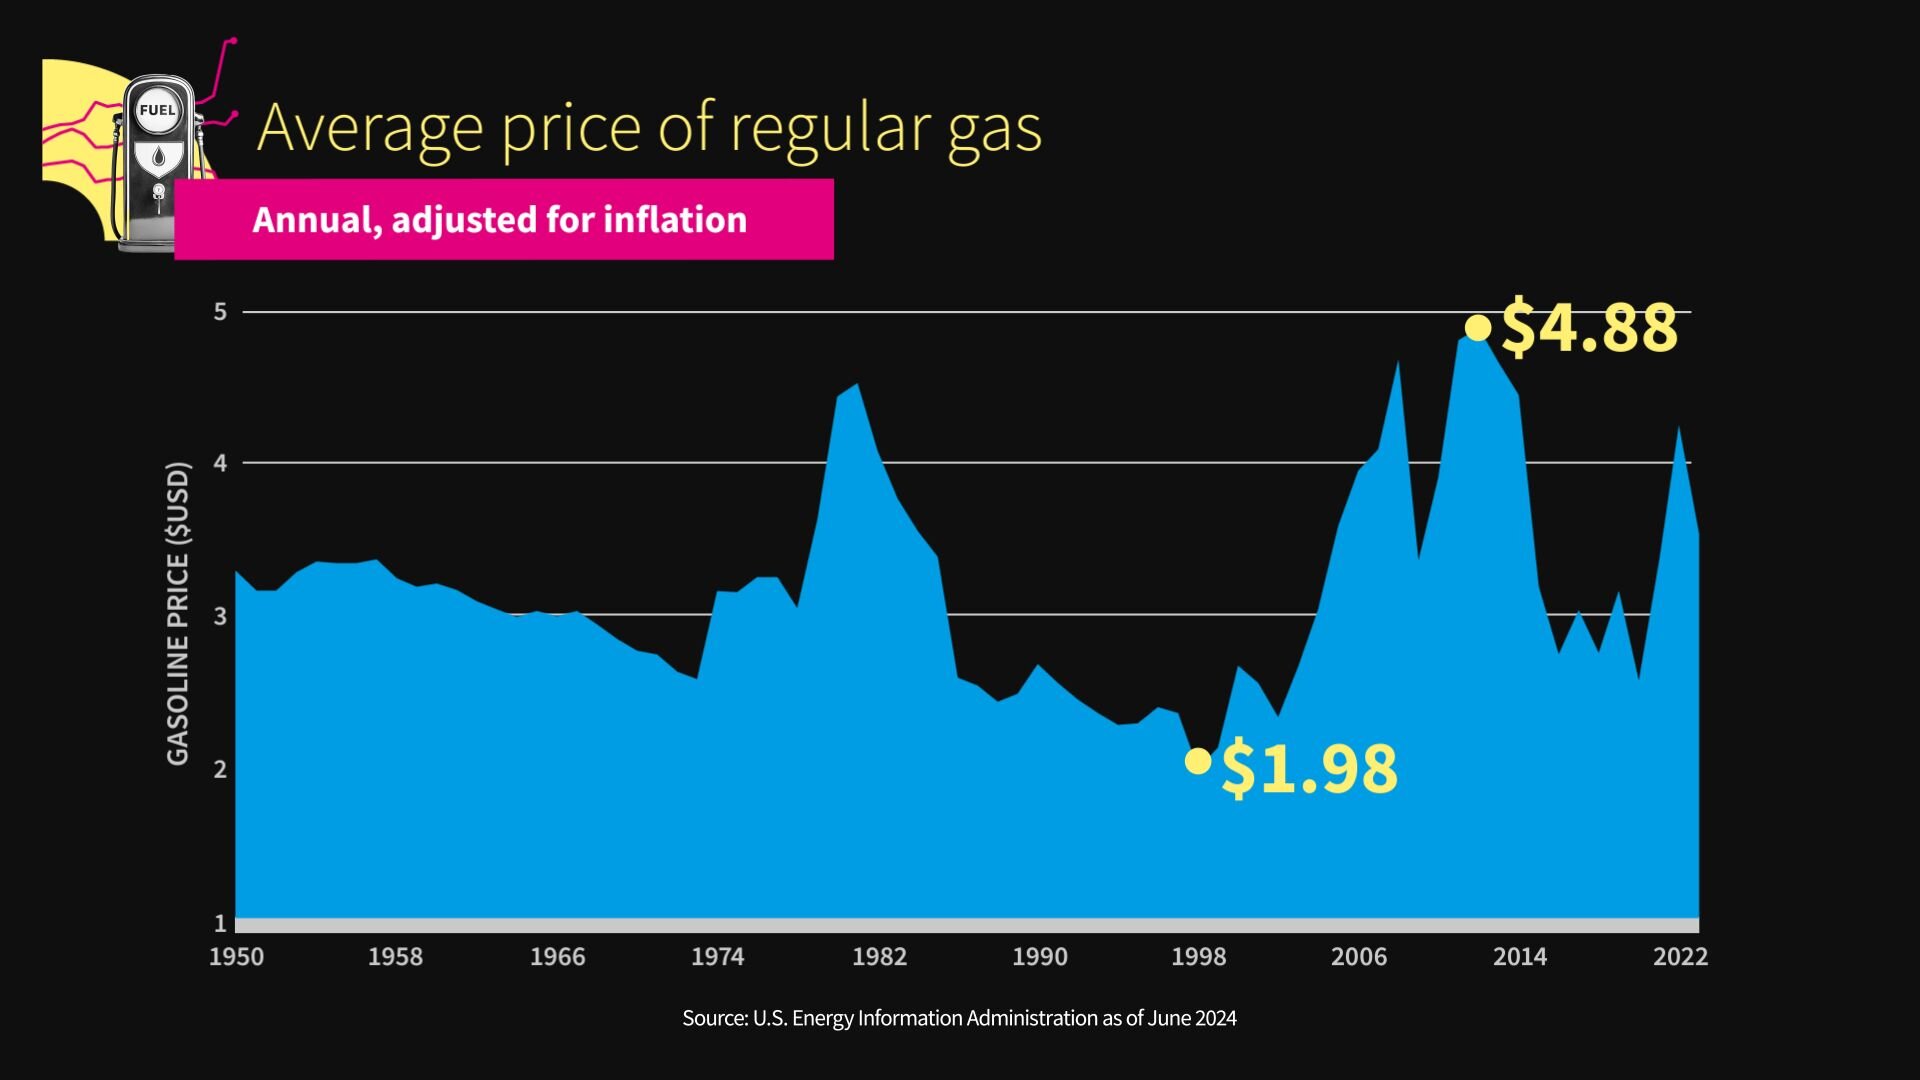
Remember, it's an average, so in some places it's more, some it's less, and all those prices include gas tax.
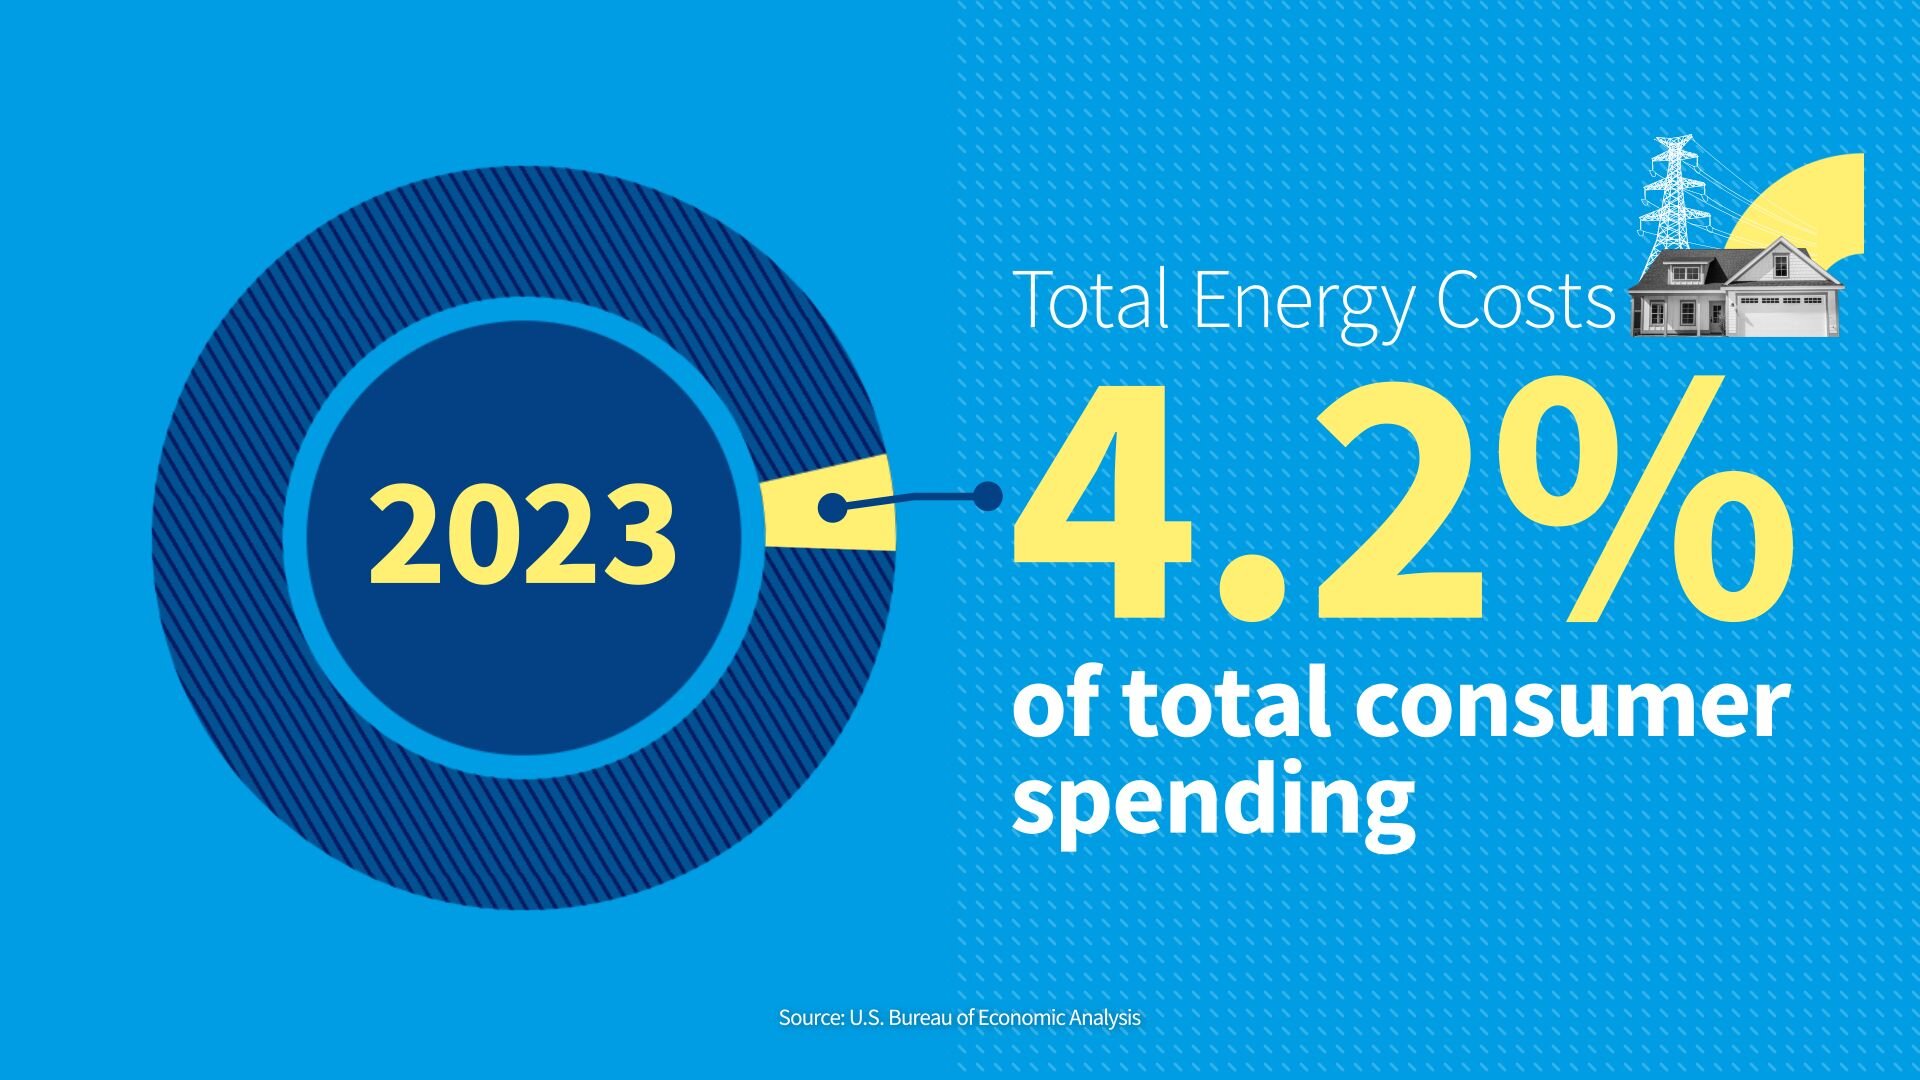
Overall, the proportion of total consumer spending spent on energy is lower today than in the past. 40 years ago, total energy costs accounted for 8% of all consumer spending. That's recently dropped to around 4.2% and frankly, that surprised me. I did think it would be higher.
Now let's look at how different sectors of our economy use energy. Our electric power sector, that is the utilities and companies that make electricity, is the biggest energy hog. It accounts for 34% of all energy use.
But here's the fact that surprised me: more than half of the energy consumed is lost in the process of getting that electricity to the consumer.
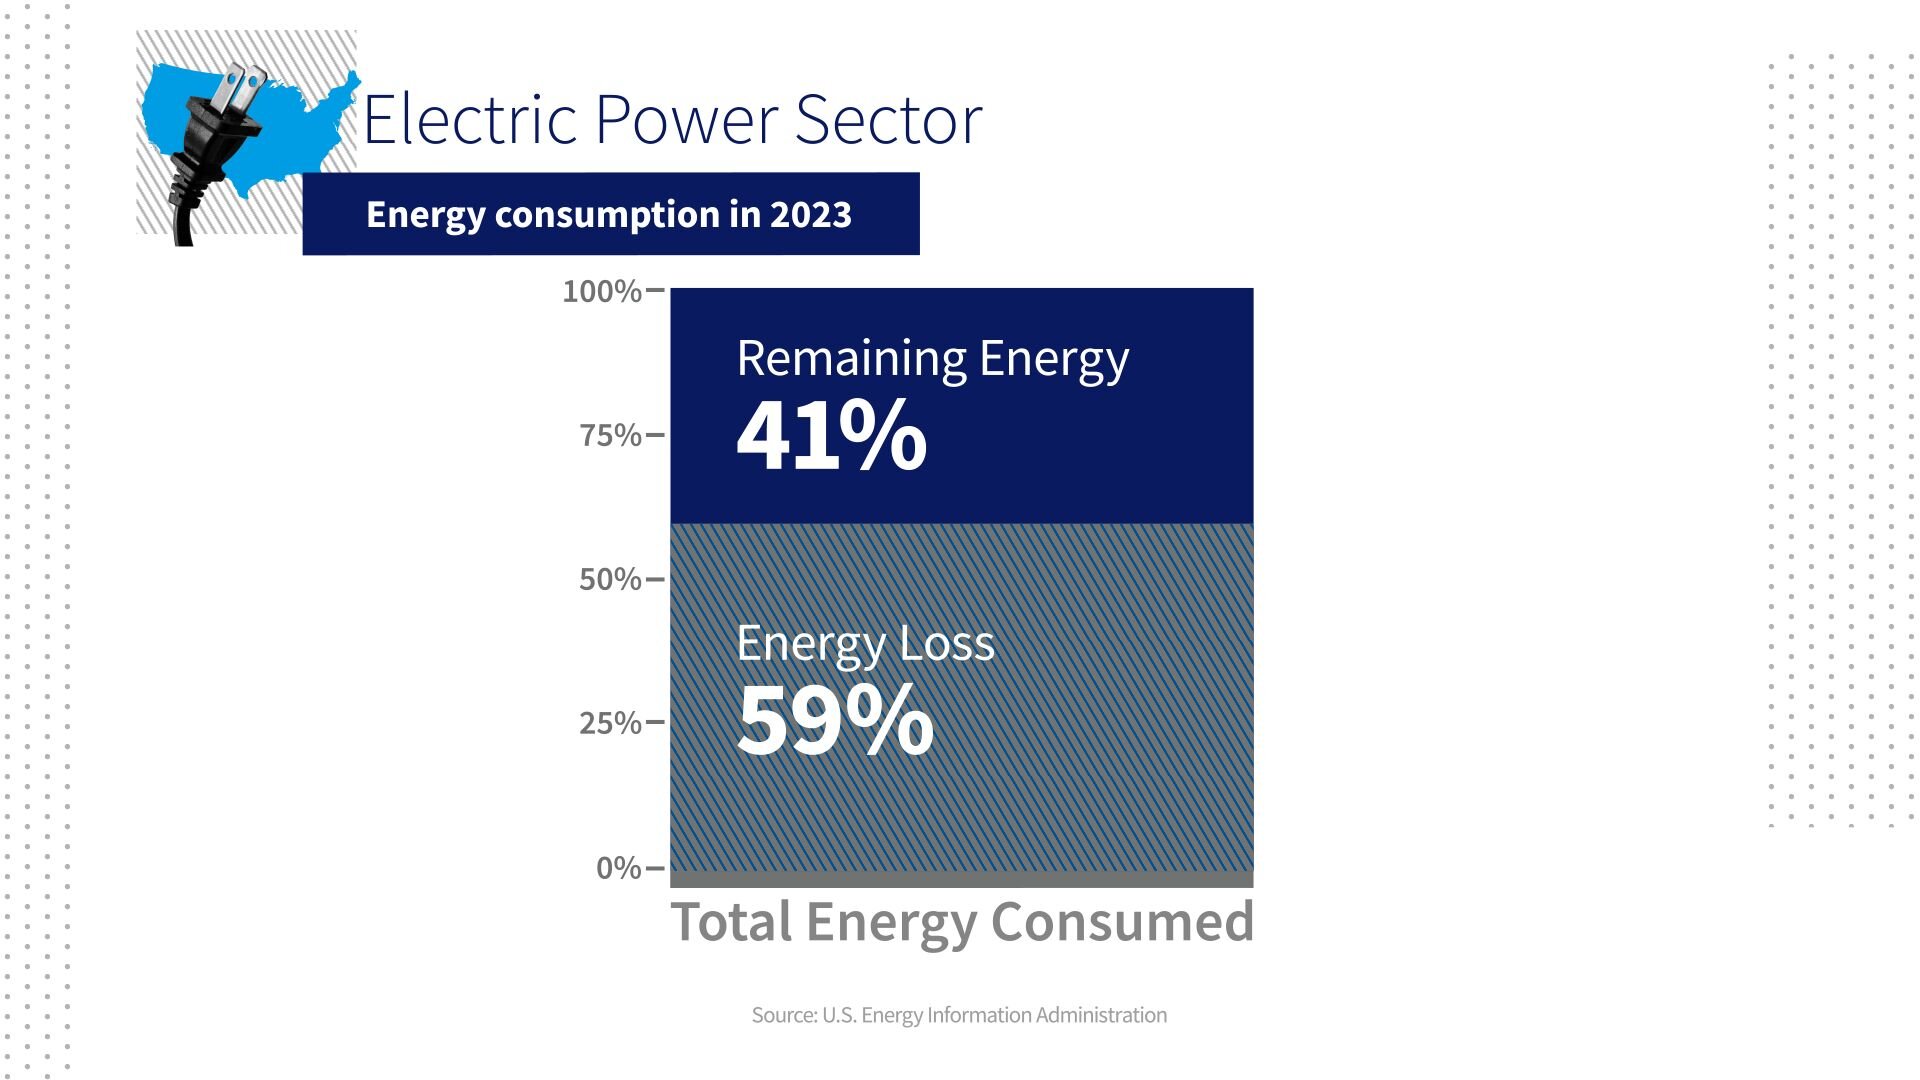
The remaining energy is used in three primary ways: residential, commercial and the industrial sector.
The other big energy consumer in our economy is transportation.
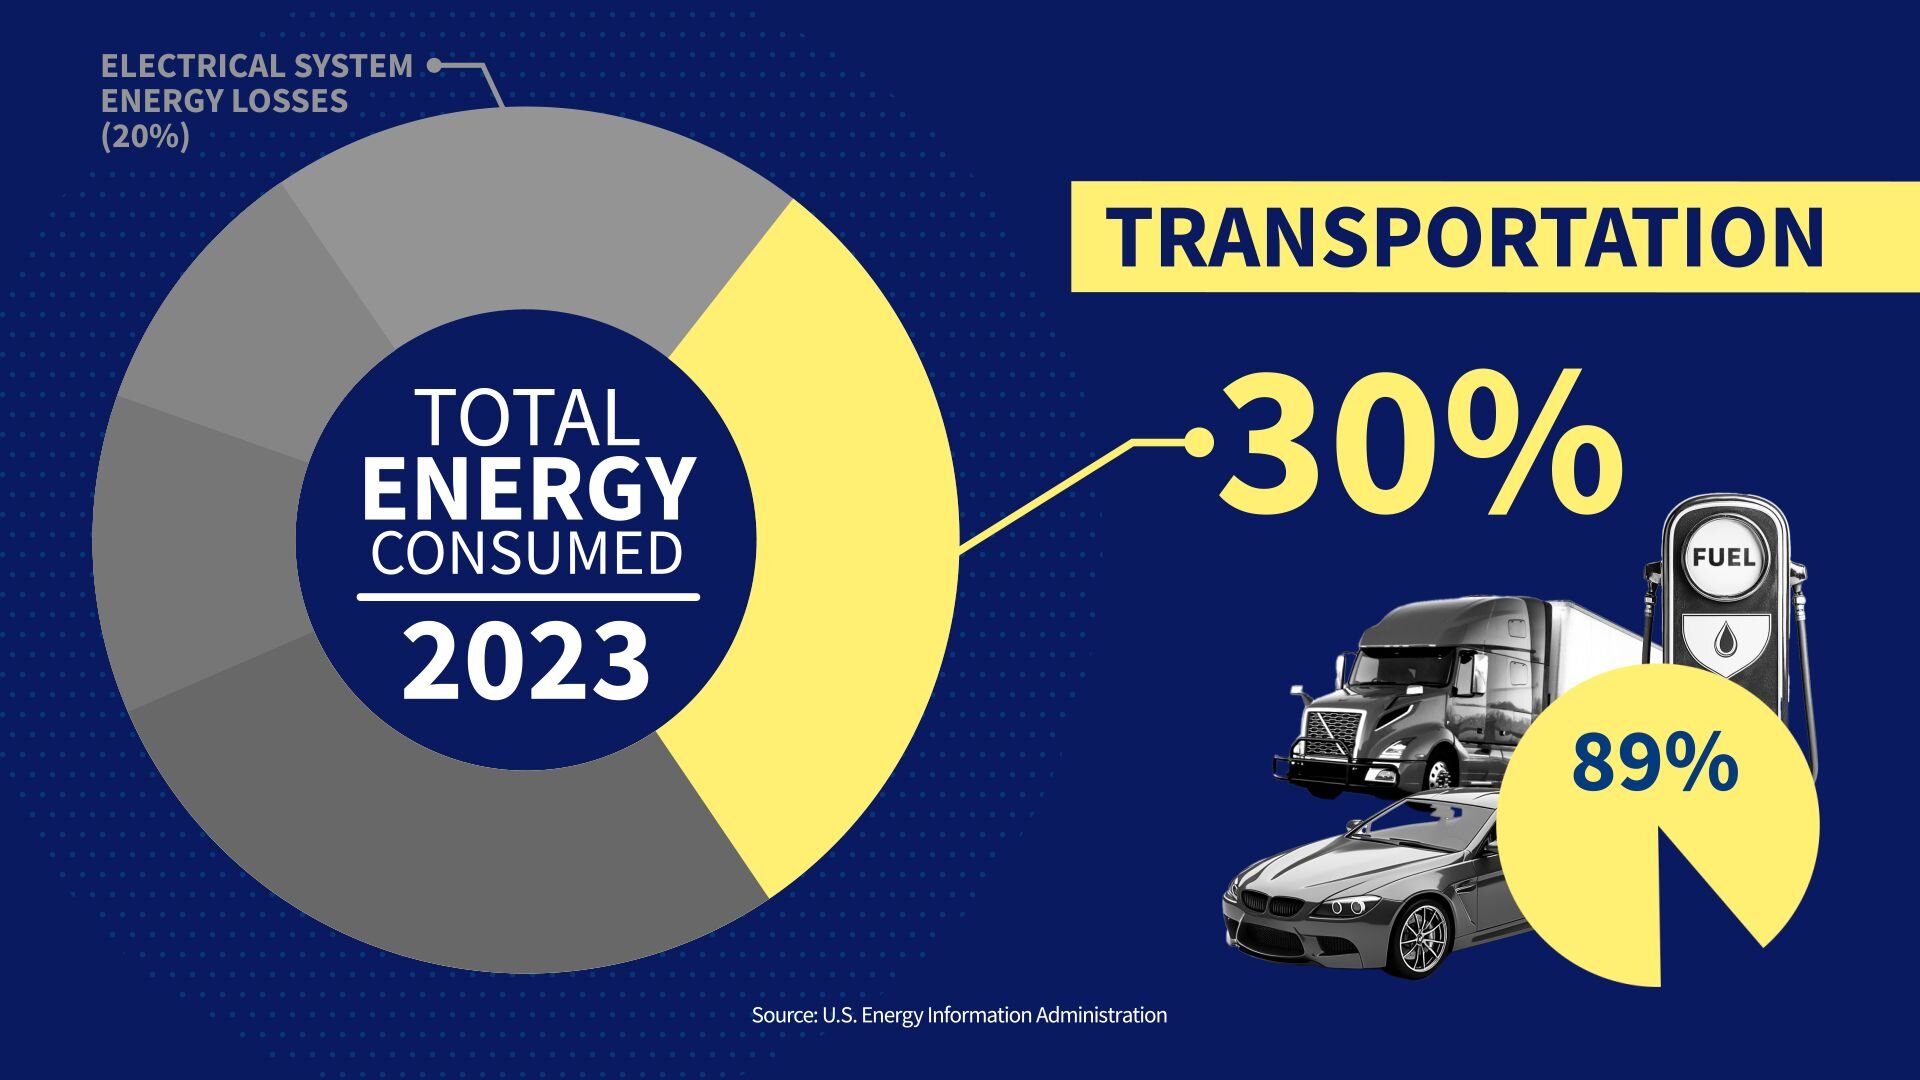
Transportation accounts for 30% of all energy consumption, almost 90% of which comes from gas and diesel fuels burned by vehicles on the road.
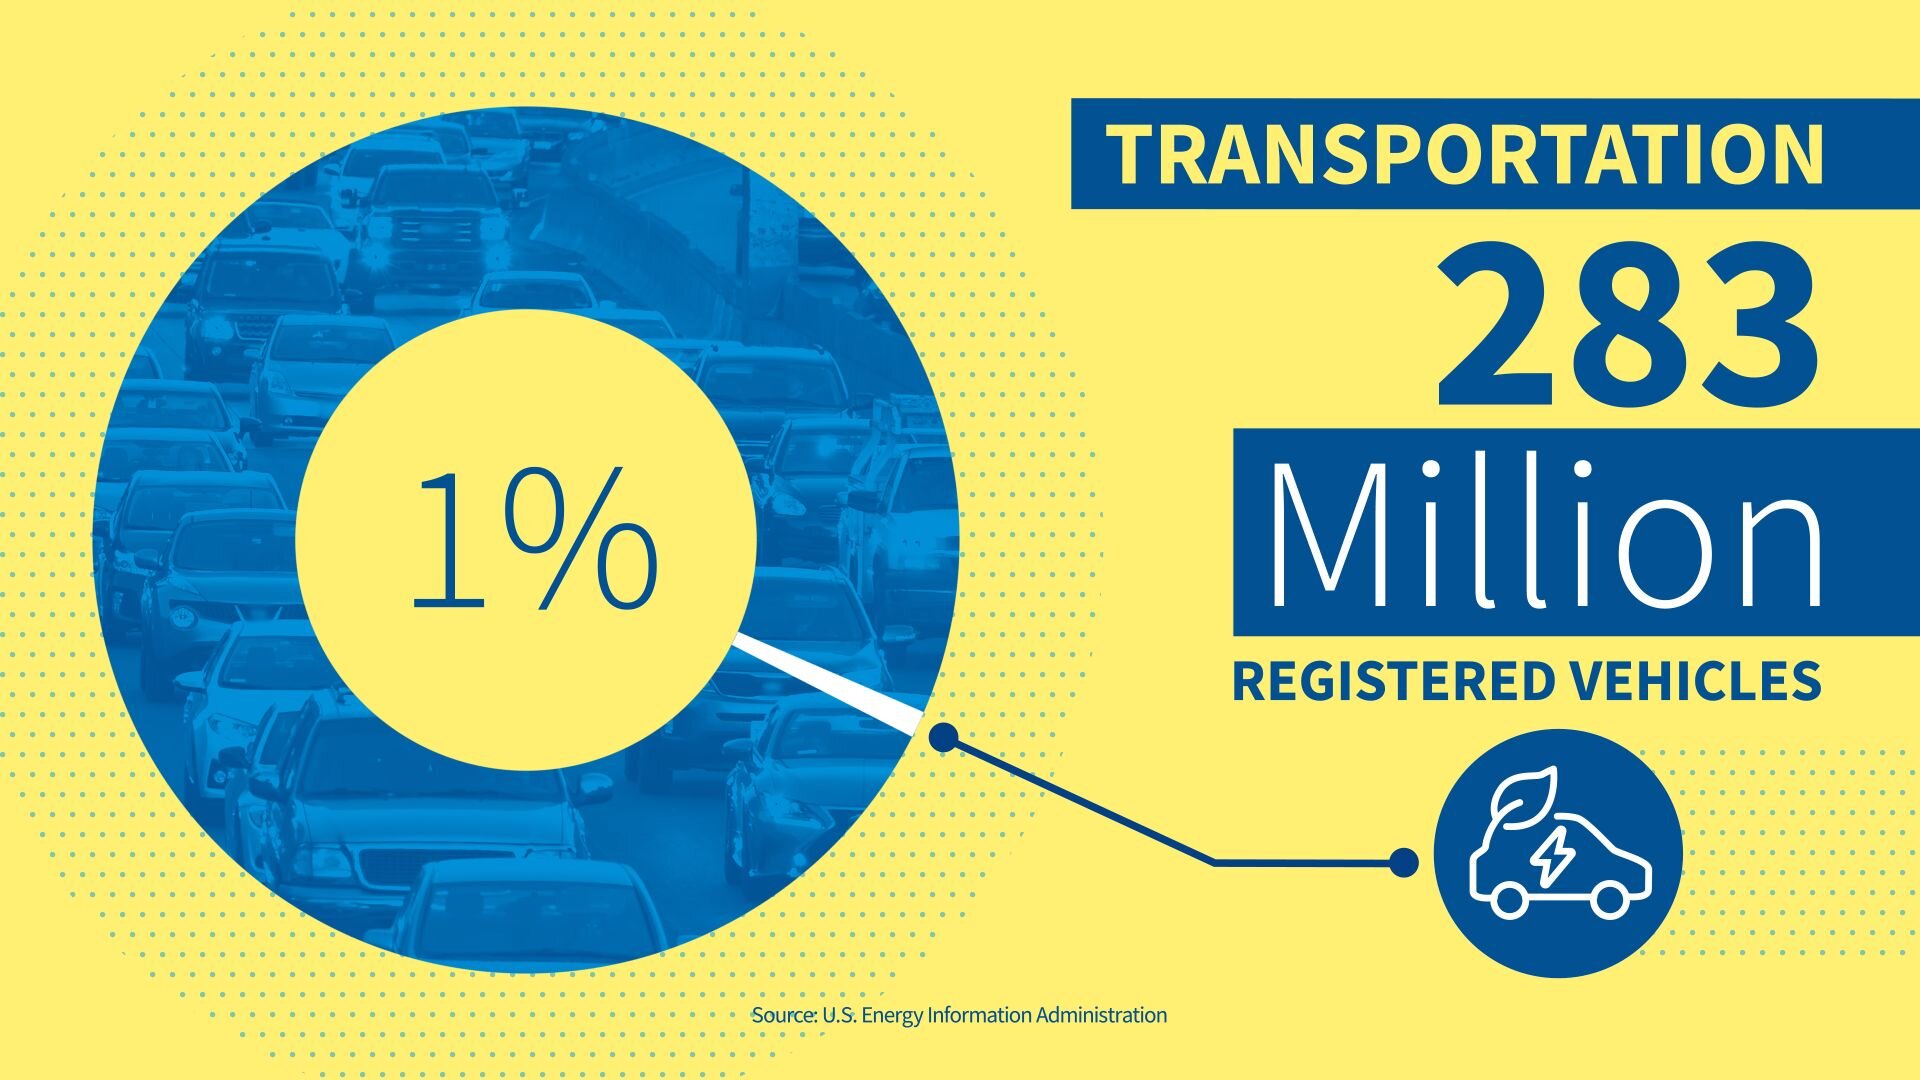
The US has more than 280 million registered vehicles.
Less than 1% of these are electric vehicles and hybrids, although they comprised over 16% of all light duty vehicle sales in the US in 2023.
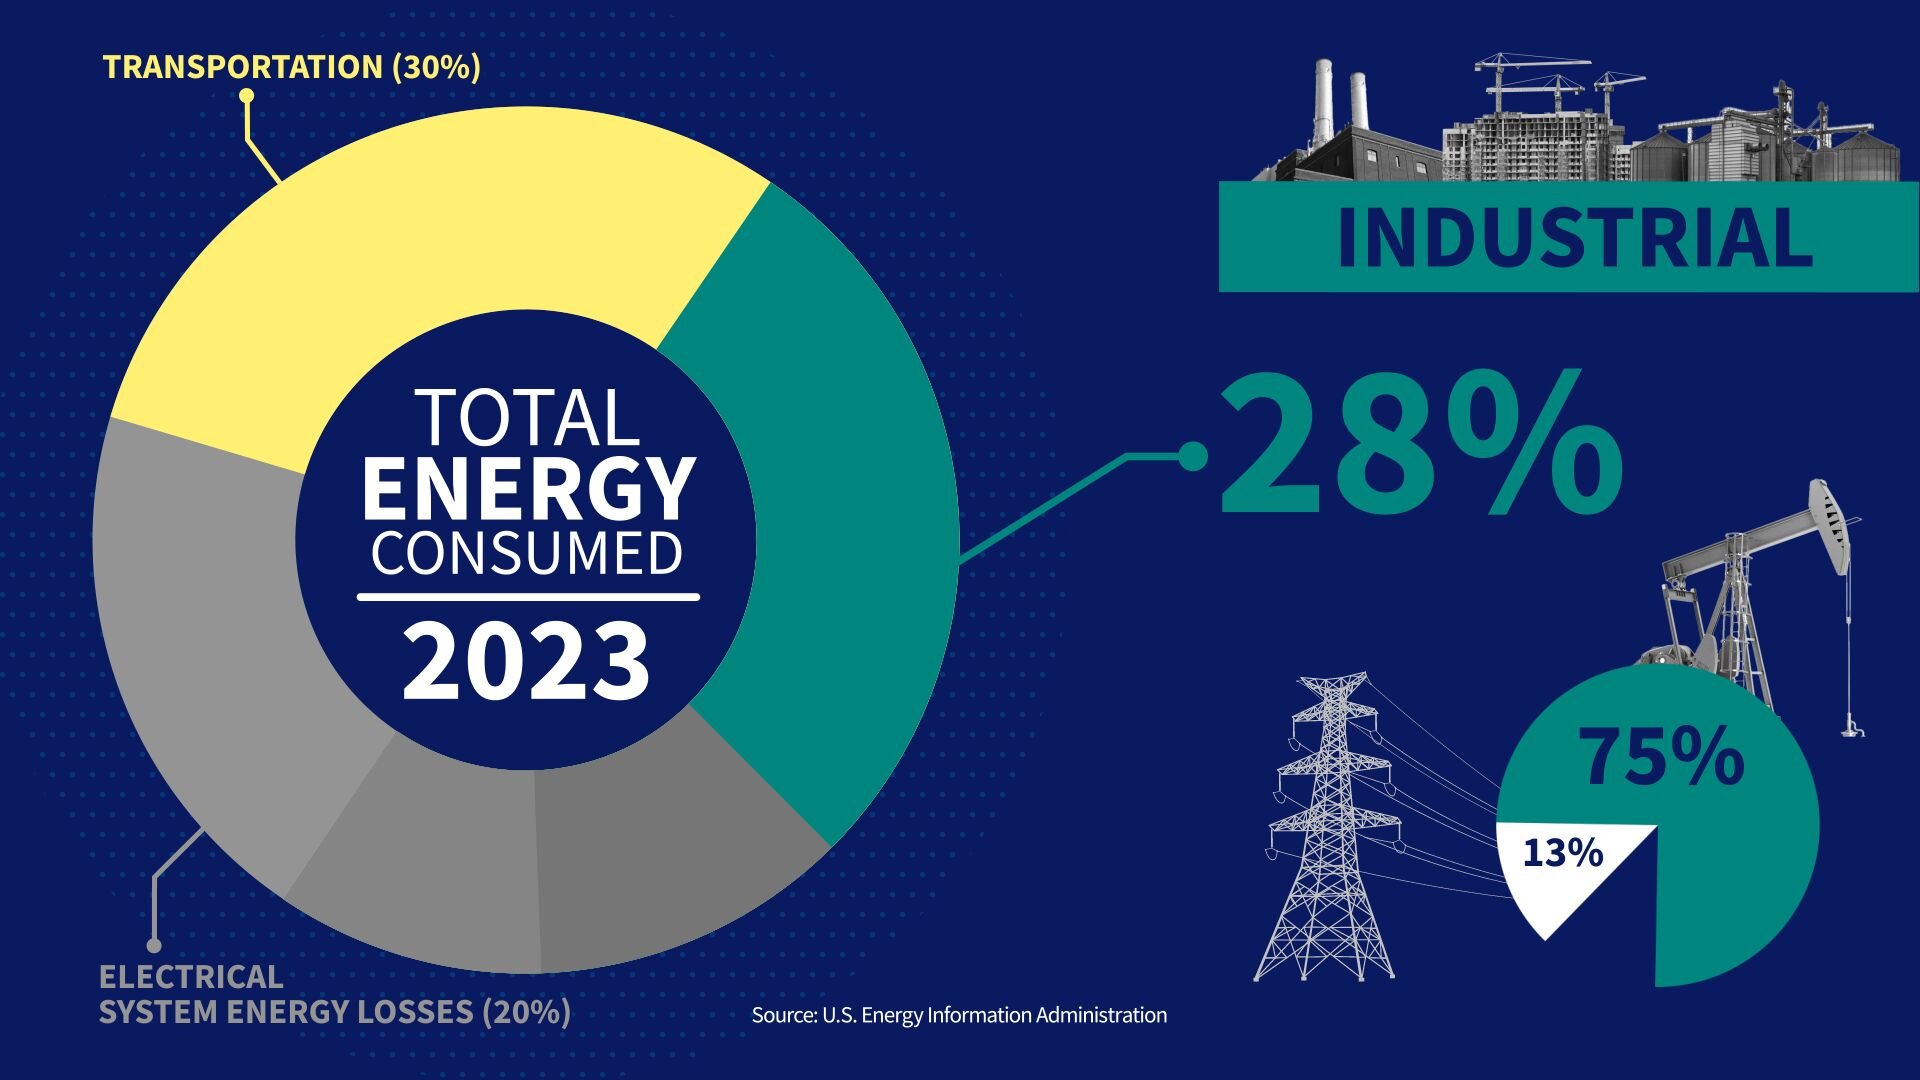
The industrial sector, which includes manufacturing, construction and agriculture, among others, is the next biggest energy consumer at 28%. 75% of this energy comes from petroleum products and natural gas, and 13% from electricity. Data Centers and artificial intelligence may increase demand from this sector.
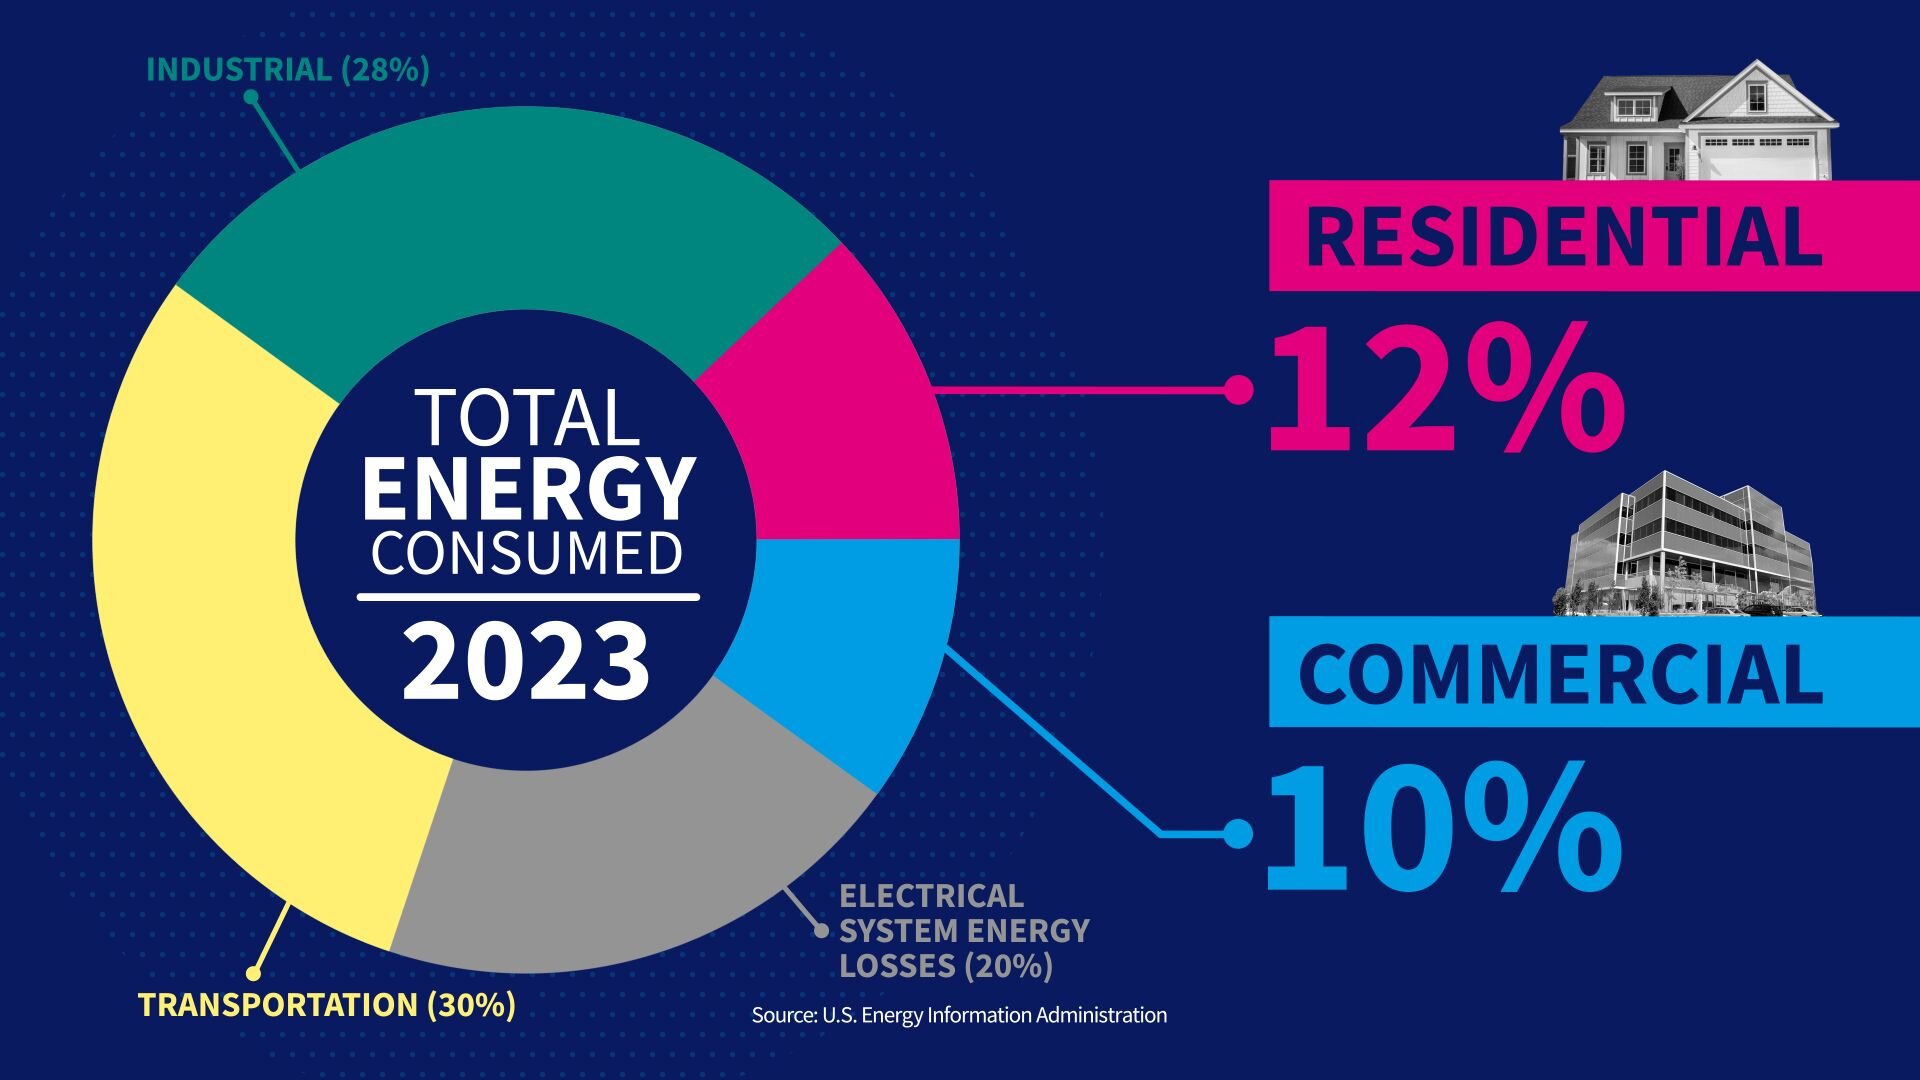
That leaves residential – our homes – at 12% and the commercial sector, which includes places like office buildings, retail stores and that all accounts for about 10% of energy use.
Let's close our look at consumption by breaking down the kinds of energy we use. Fossil fuels – like oil, coal, and natural gas – still provide most of America's energy needs.
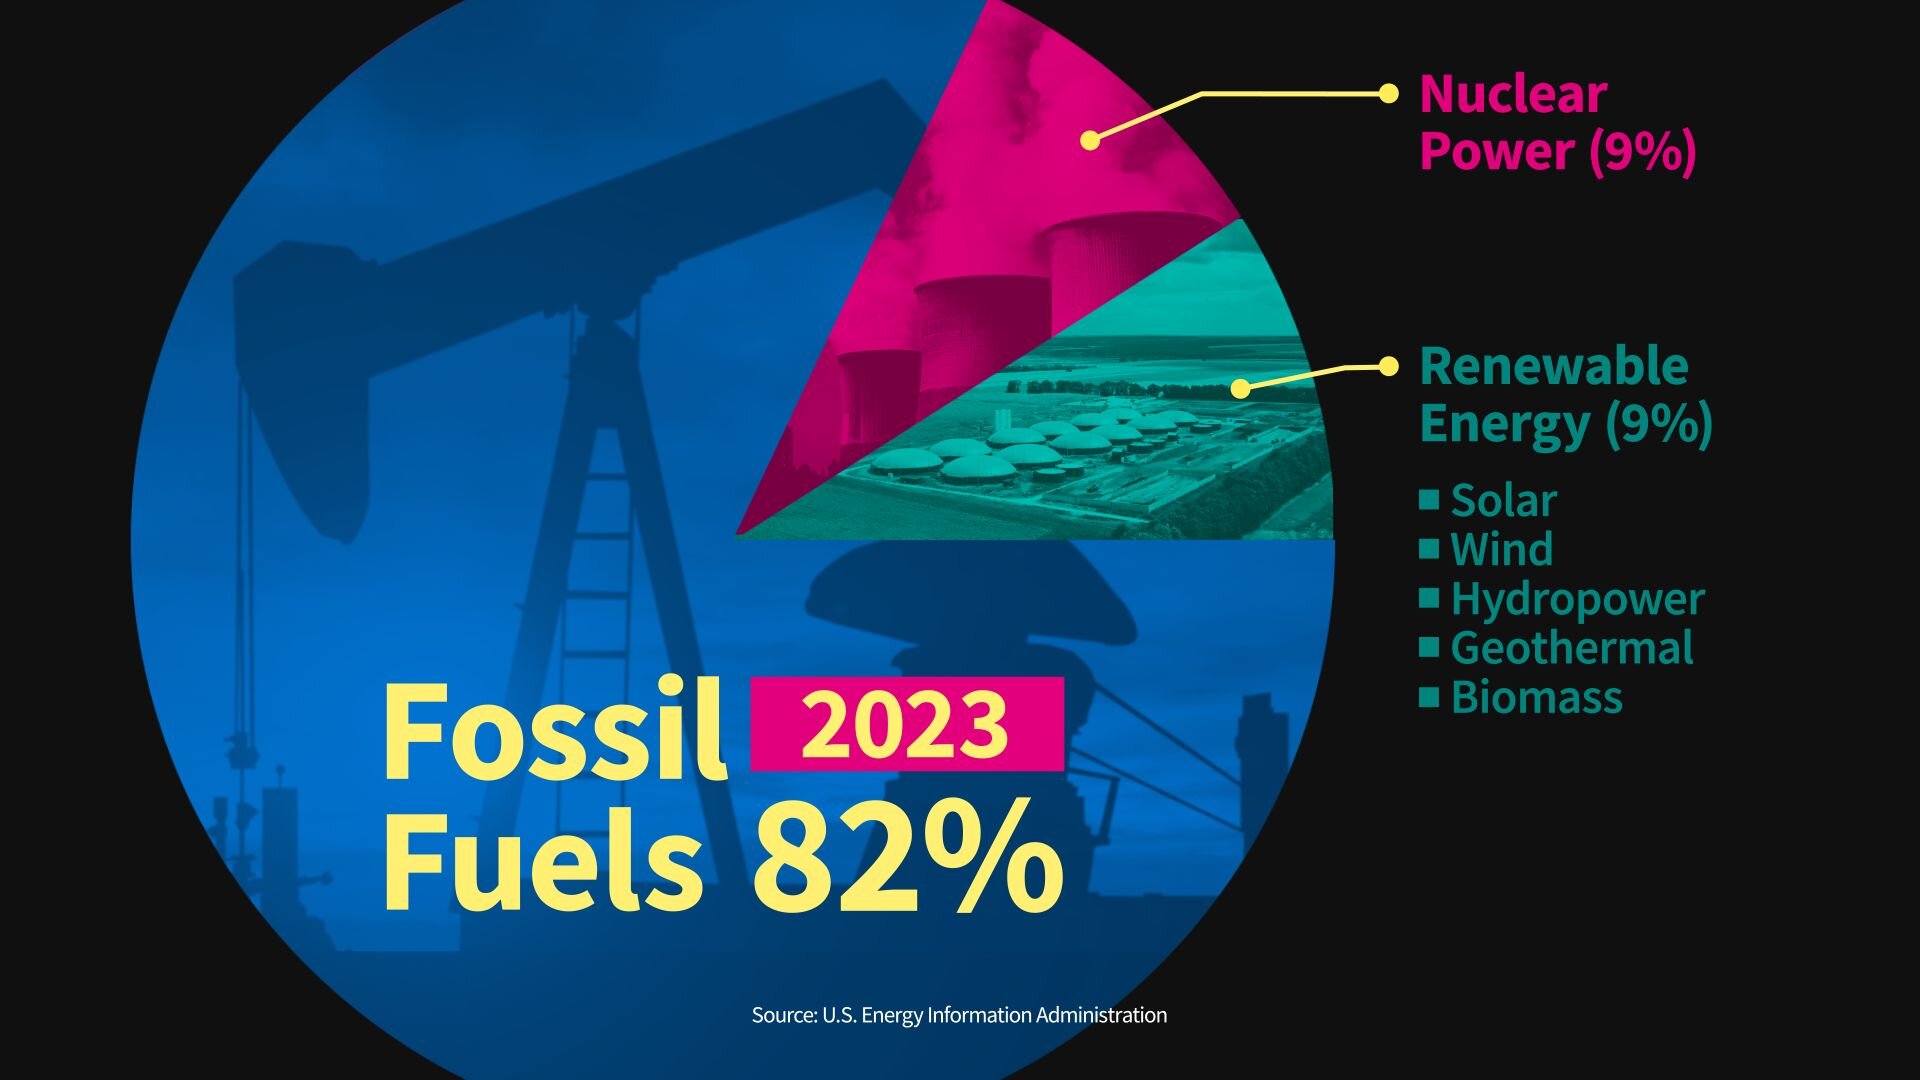
20 years ago, fossil fuels accounted for 88% of our energy consumption. In 2023 it was 82% with nuclear power accounting for 9% and renewable energy, which includes solar, wind, hydropower, geothermal and biomass, like ethanol, accounted for 9%.
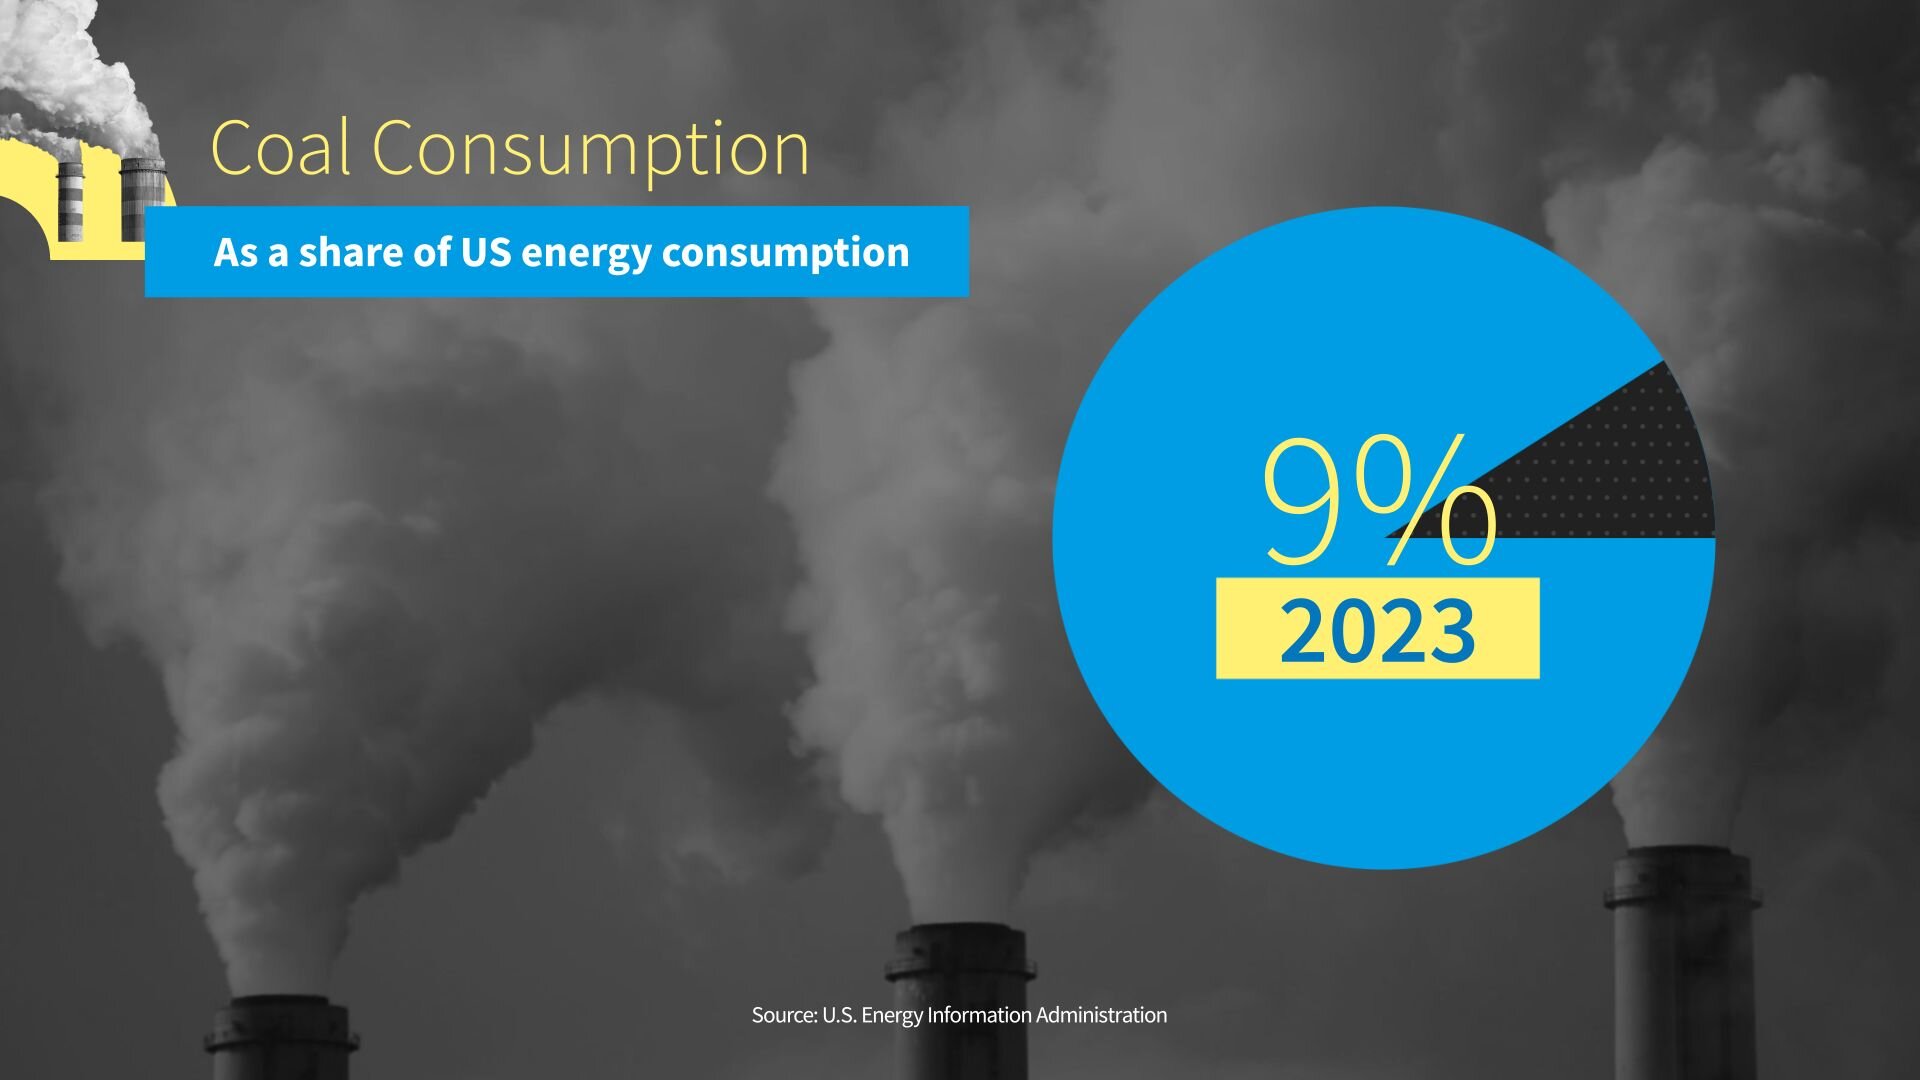
The most significant shift in our energy mix is the steep drop in coal from 37% of America's energy use in 1950 to only 9% in 2023.
Now let’s talk about energy production.
Big picture, America’s production of oil, natural gas and renewables is growing, with natural gas growing most of all.
In 1950 natural gas was about 18% of total US energy production. In 2023, it was about 38%.
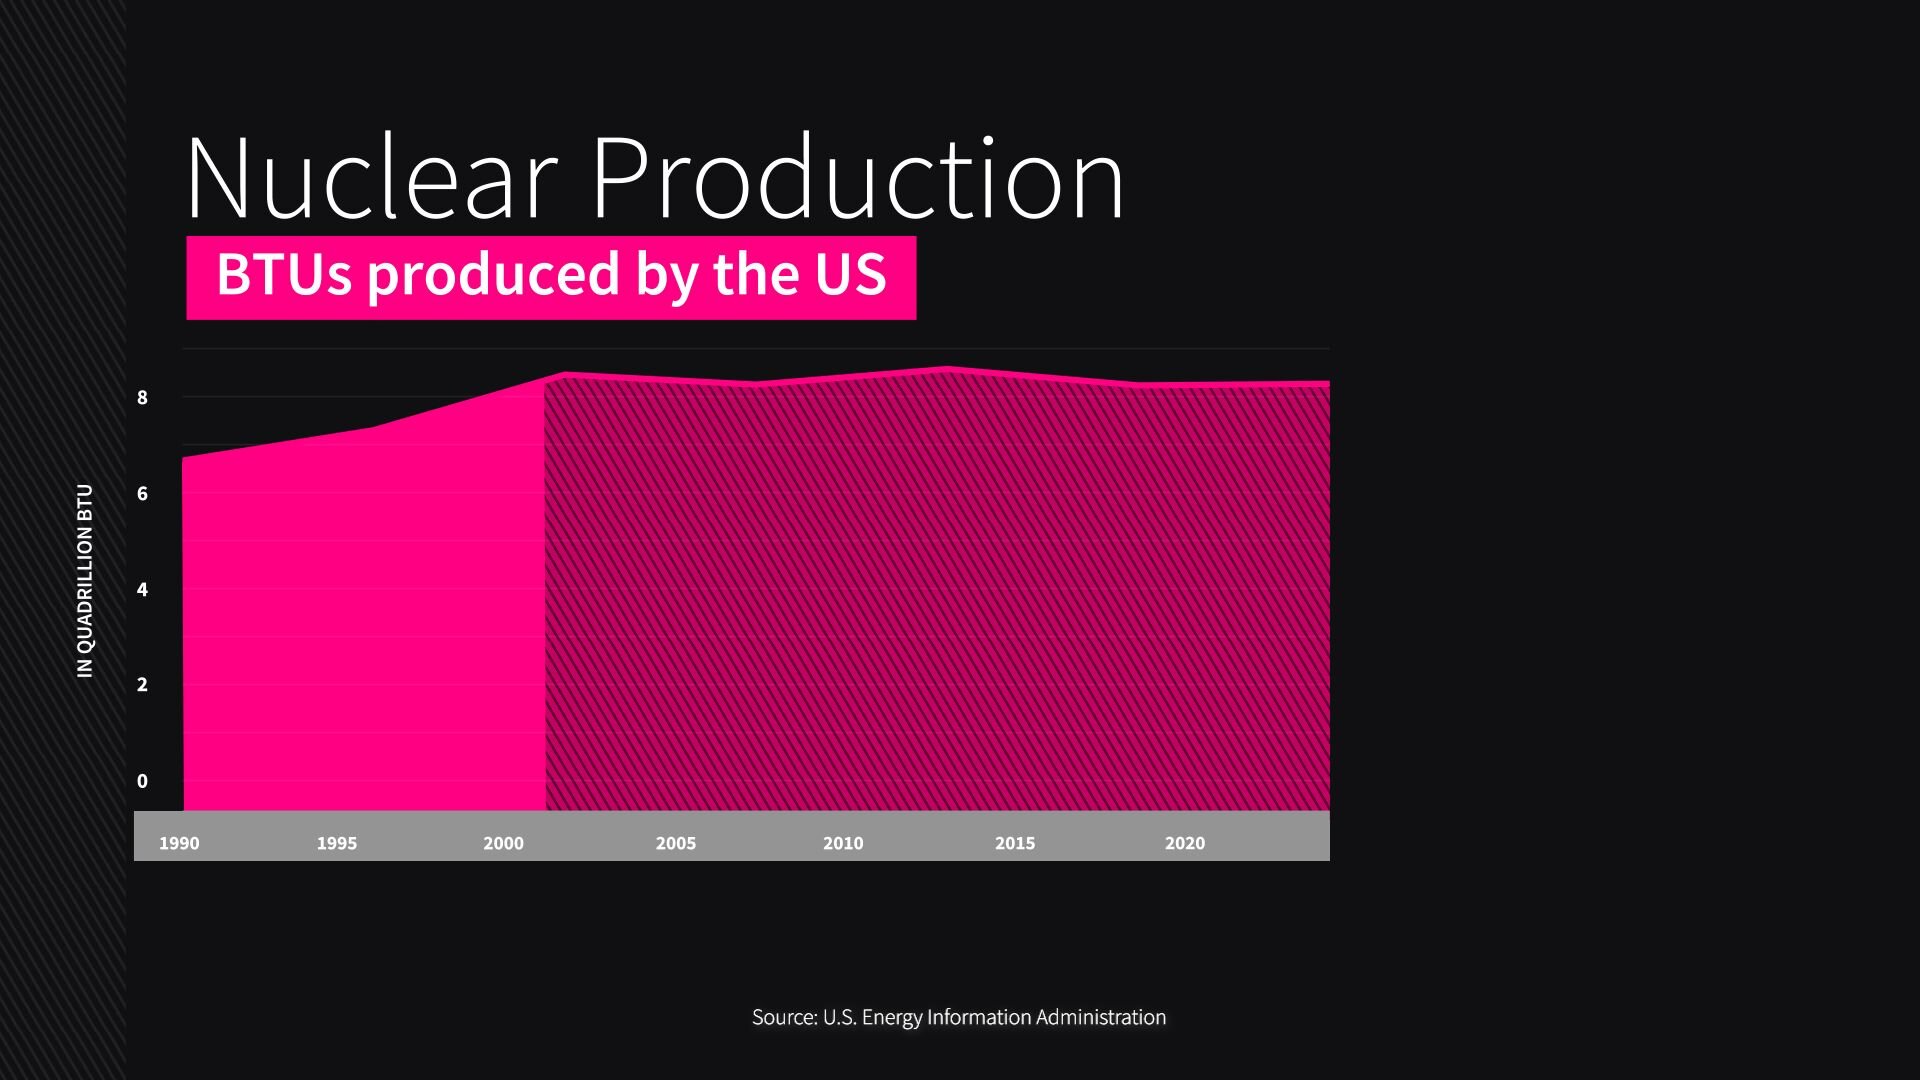
Nuclear production has remained relatively flat since about 2001.
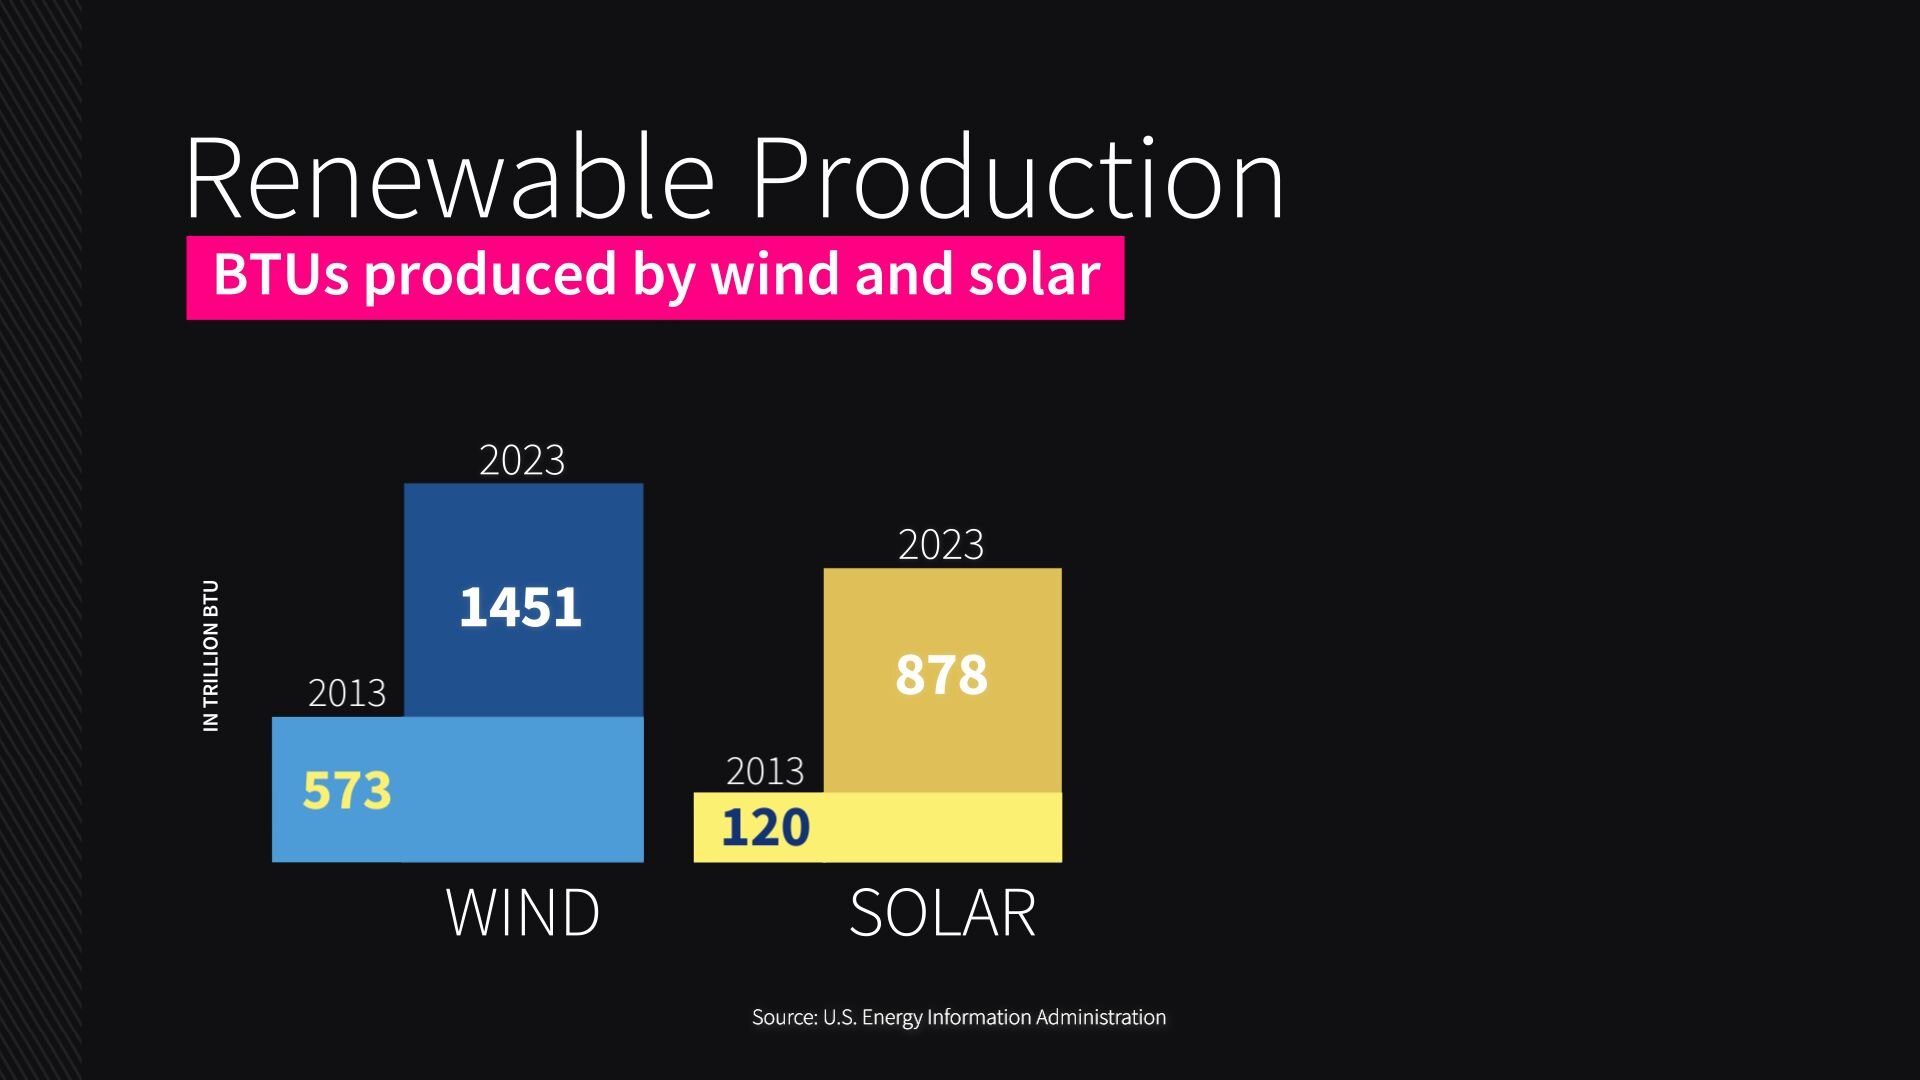
Renewables are growing fast – with wind production more than doubling over the last decade, and solar growing by a factor of seven – but they remain a small part of our overall energy mix, with wind accounting for just 1% and solar just 1%.
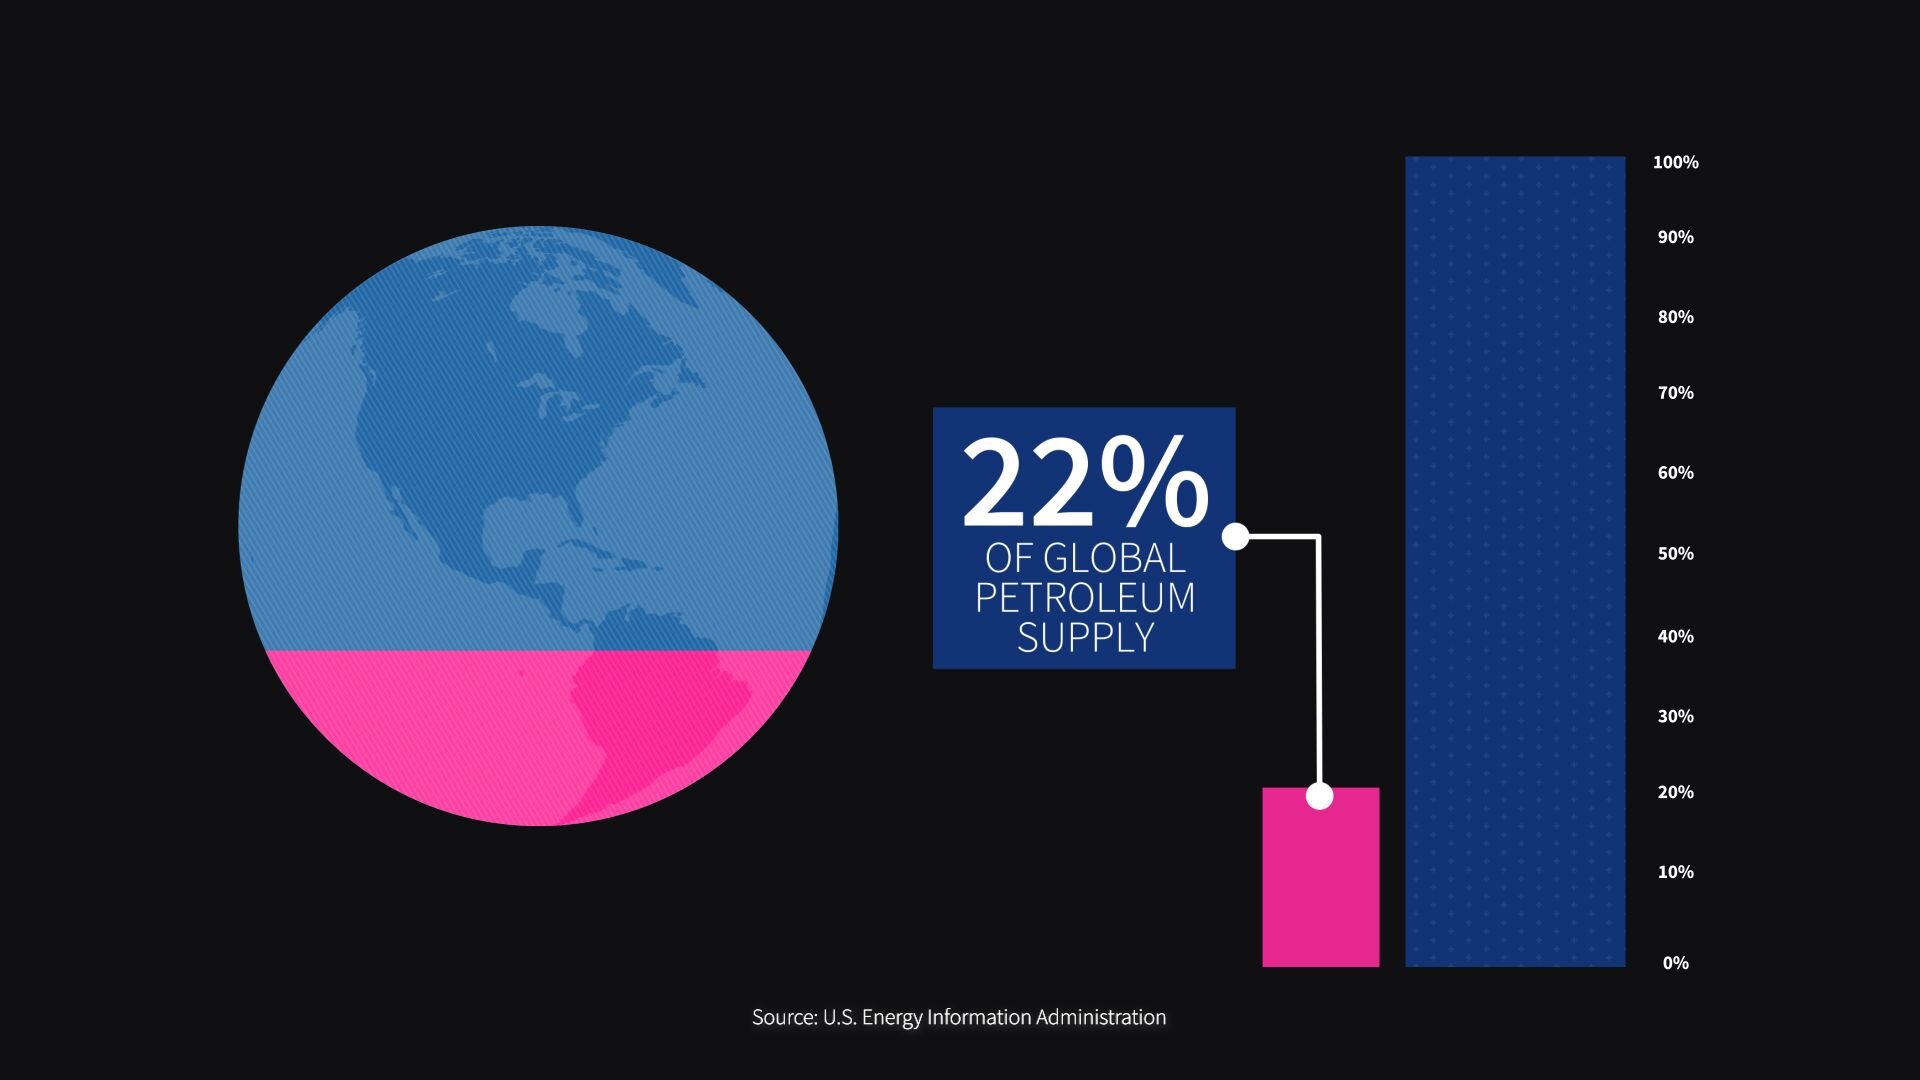
As for oil, US domestic crude oil production has more than doubled since 2000. In 2023, we produced nearly 22 million barrels daily, or around 22% of the global world supply.
We exported an average of 4.1 million barrels daily, but we also imported nearly 6.5 million barrels a day.
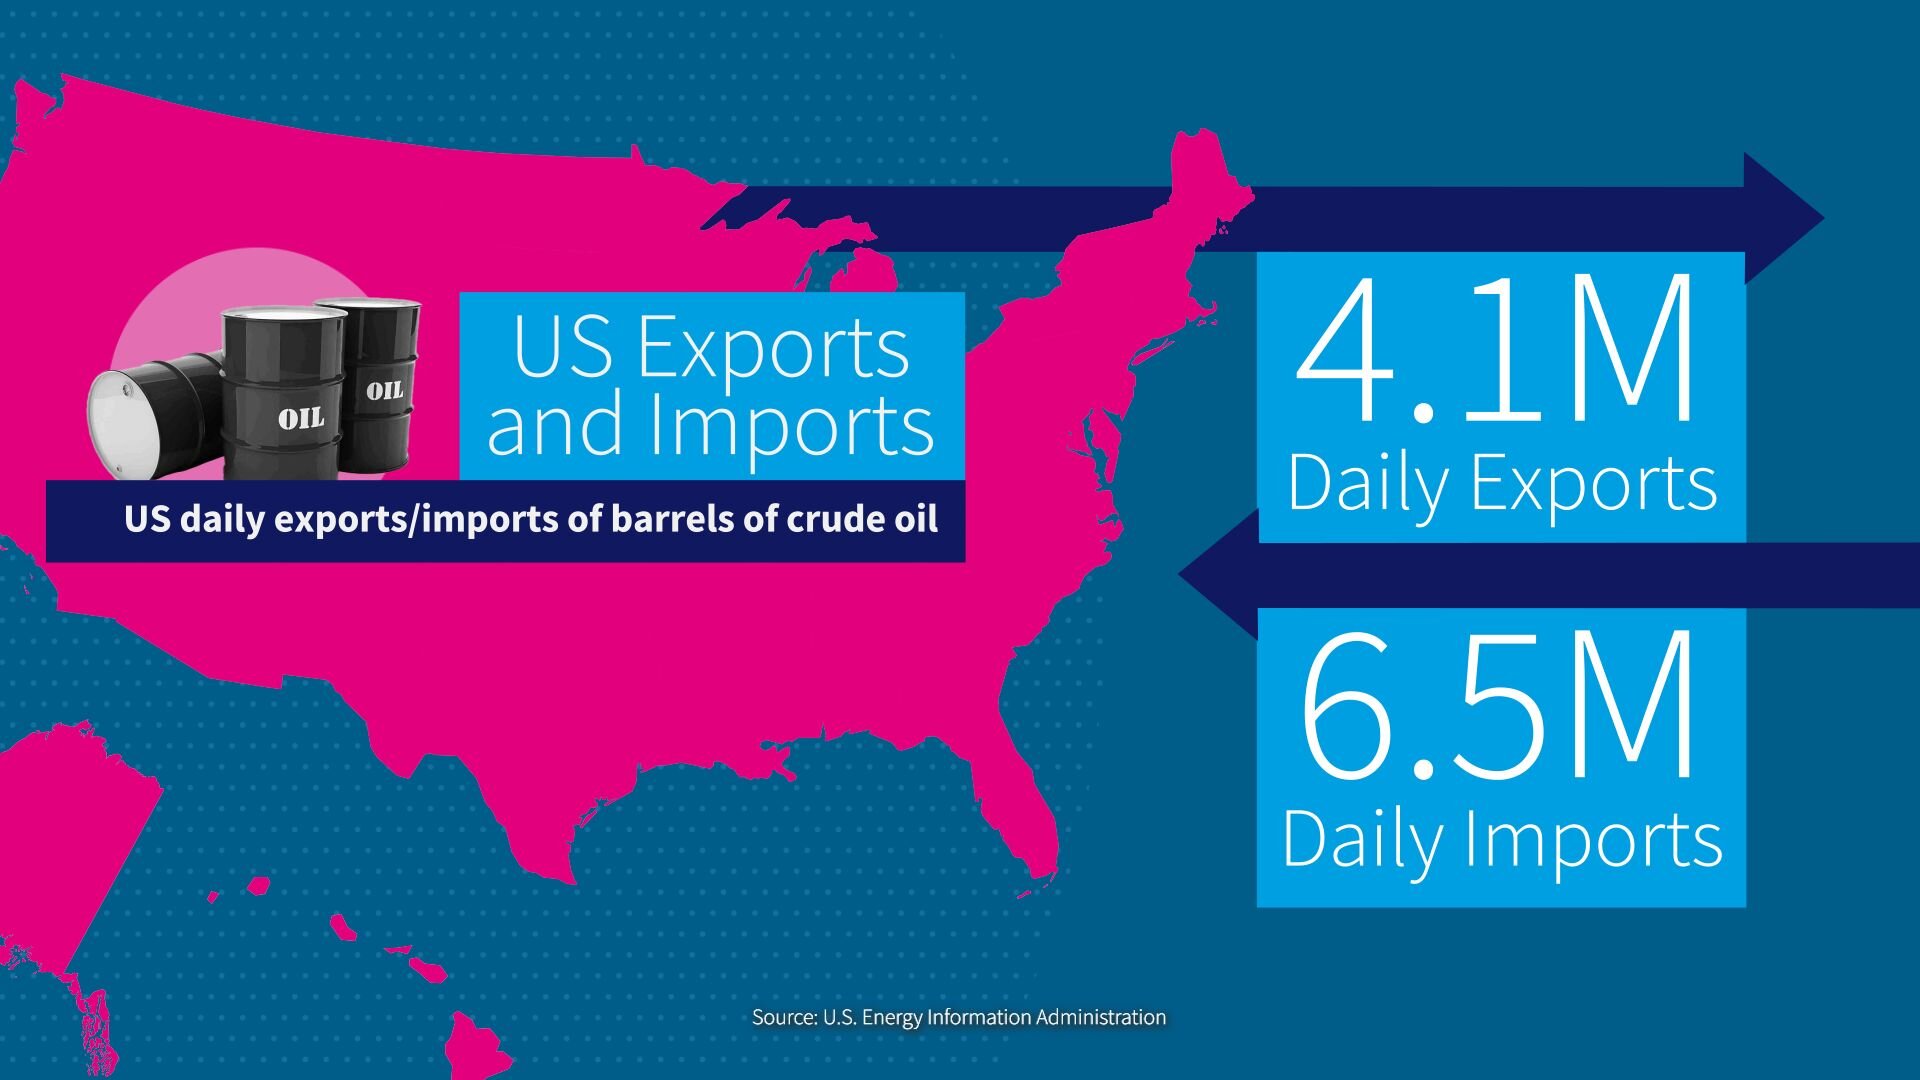
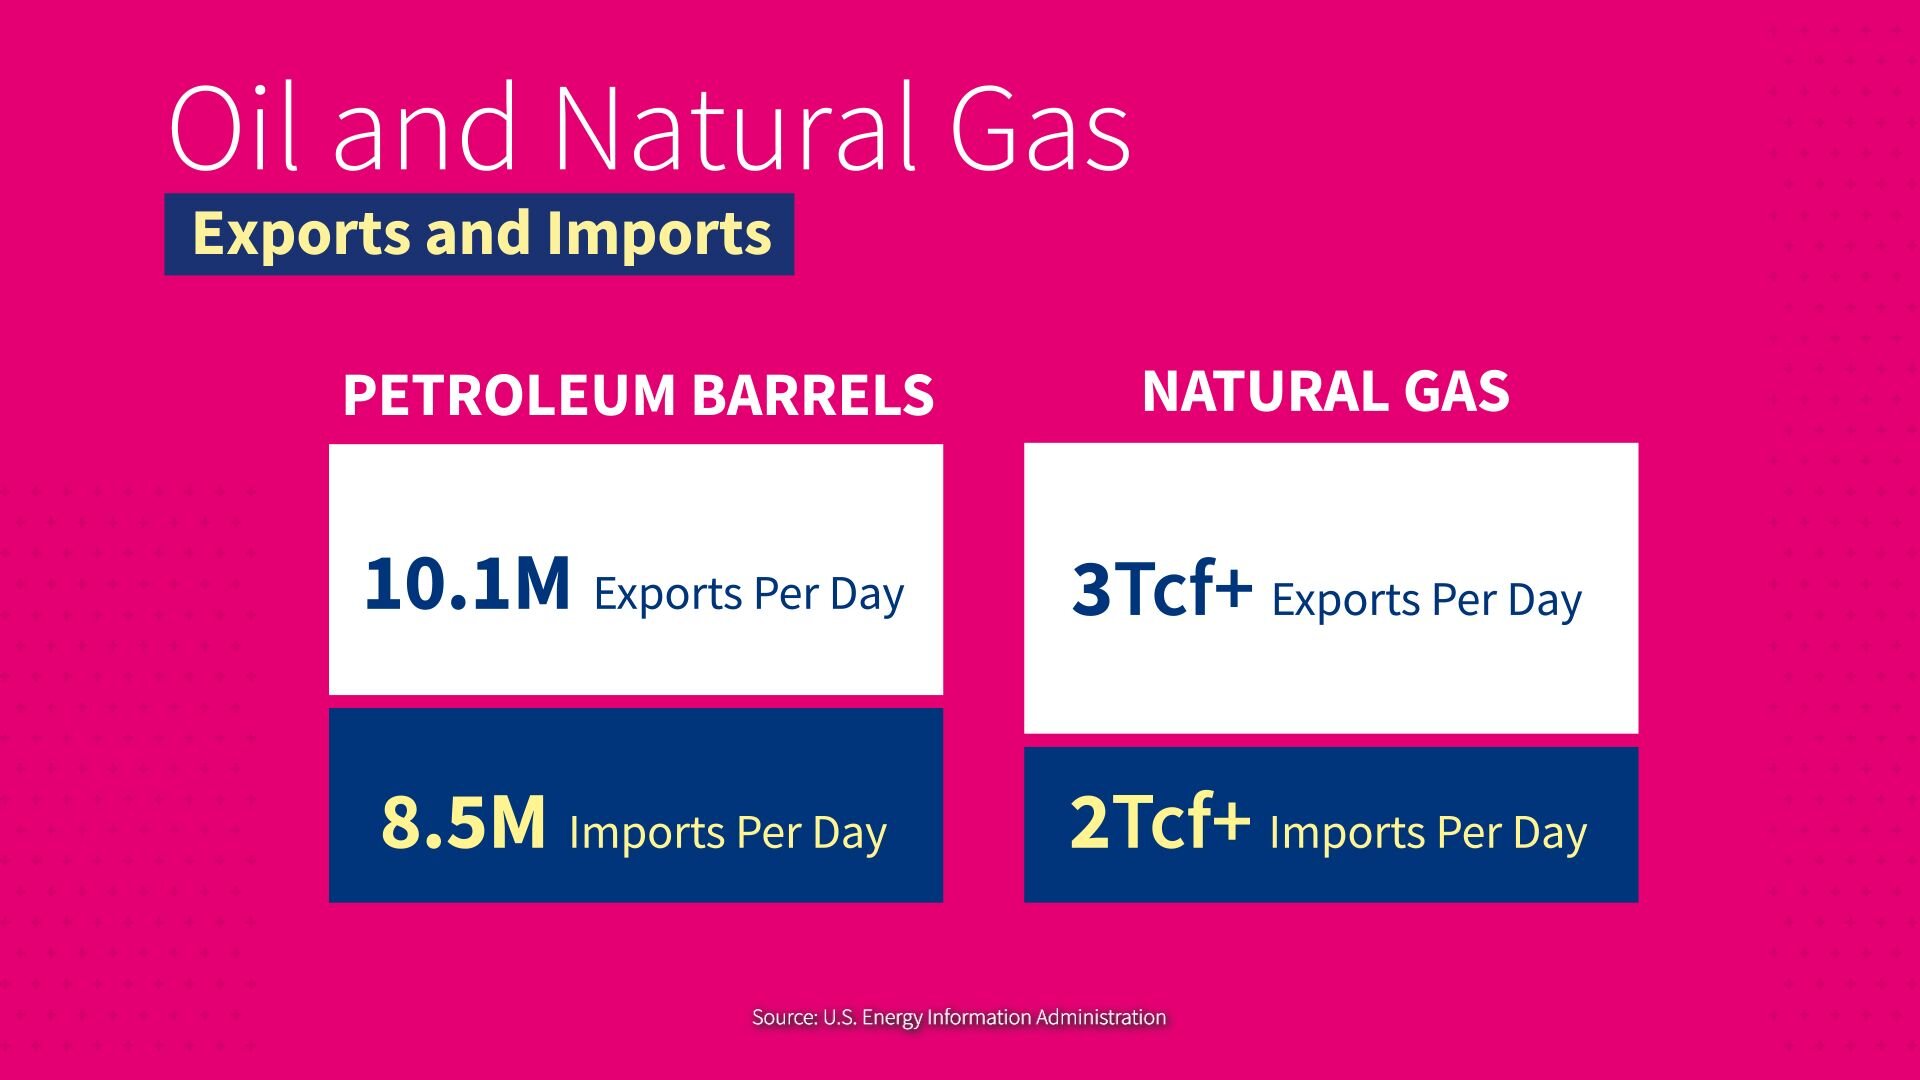
Wait a second. Why are we importing energy and exporting energy at the same time? Glad you asked. Depending on where the oil and gas is found in the US, it may or may not be easily transported, refined or processed for US consumers, and not all oil is alike. Sometimes it can make sense to ship oil or natural gas abroad while importing other forms of oil and gas for use in the US market.
The US is the world's number one producer of oil and the number one producer of gas.
In 2020, for the first time on record, the US began a streak of being a net exporter of petroleum, and we have been a net exporter of natural gas since 2017.
Through the 2021 Inflation Reduction Act, the US government now offers an array of tax credits to incentivize the production of renewable energies and the adoption of more electric vehicles, and many states have passed rules requiring their utilities to produce more electricity from renewable sources.
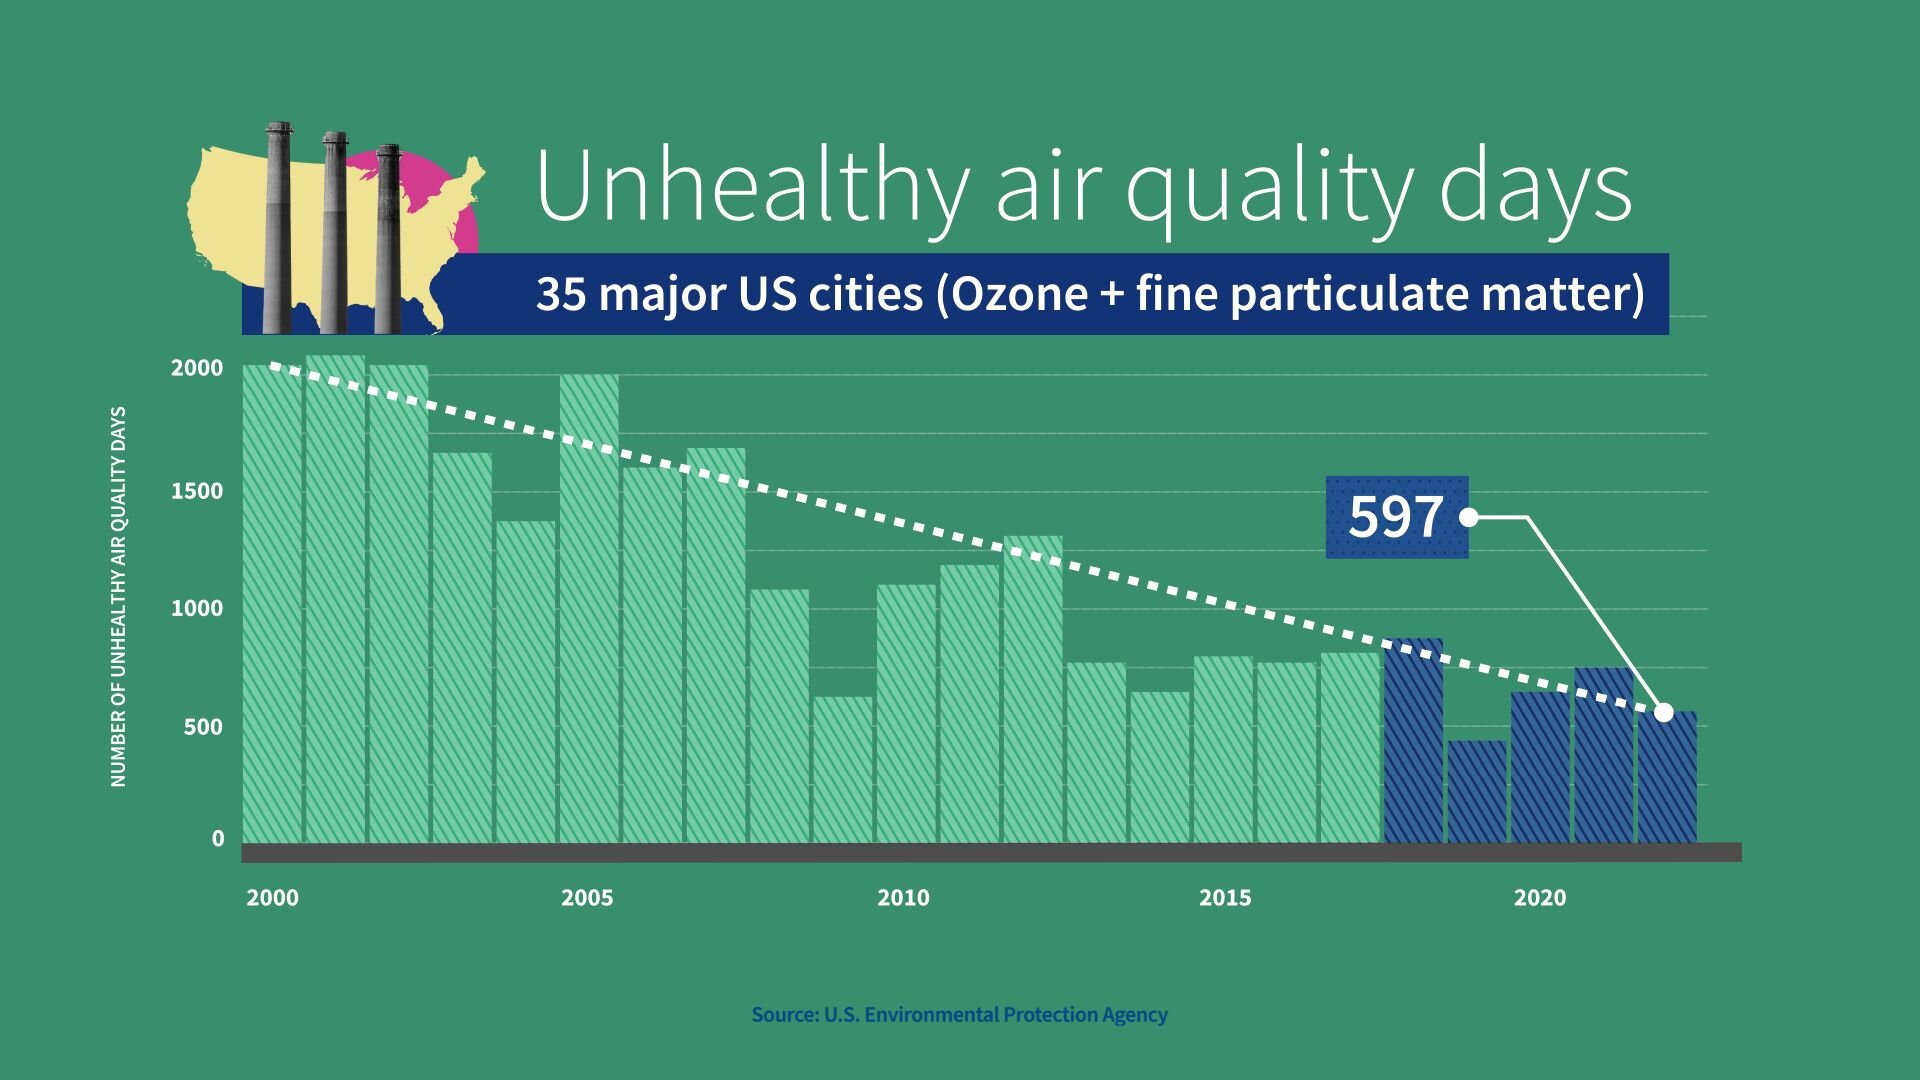
Shifting gears, let’s talk about the environment. Let's start with good news: Air pollution levels across the United States are improving.
In the last five years, major US cities have had two thirds fewer unhealthy air quality days than we did two decades ago. Fantastic!
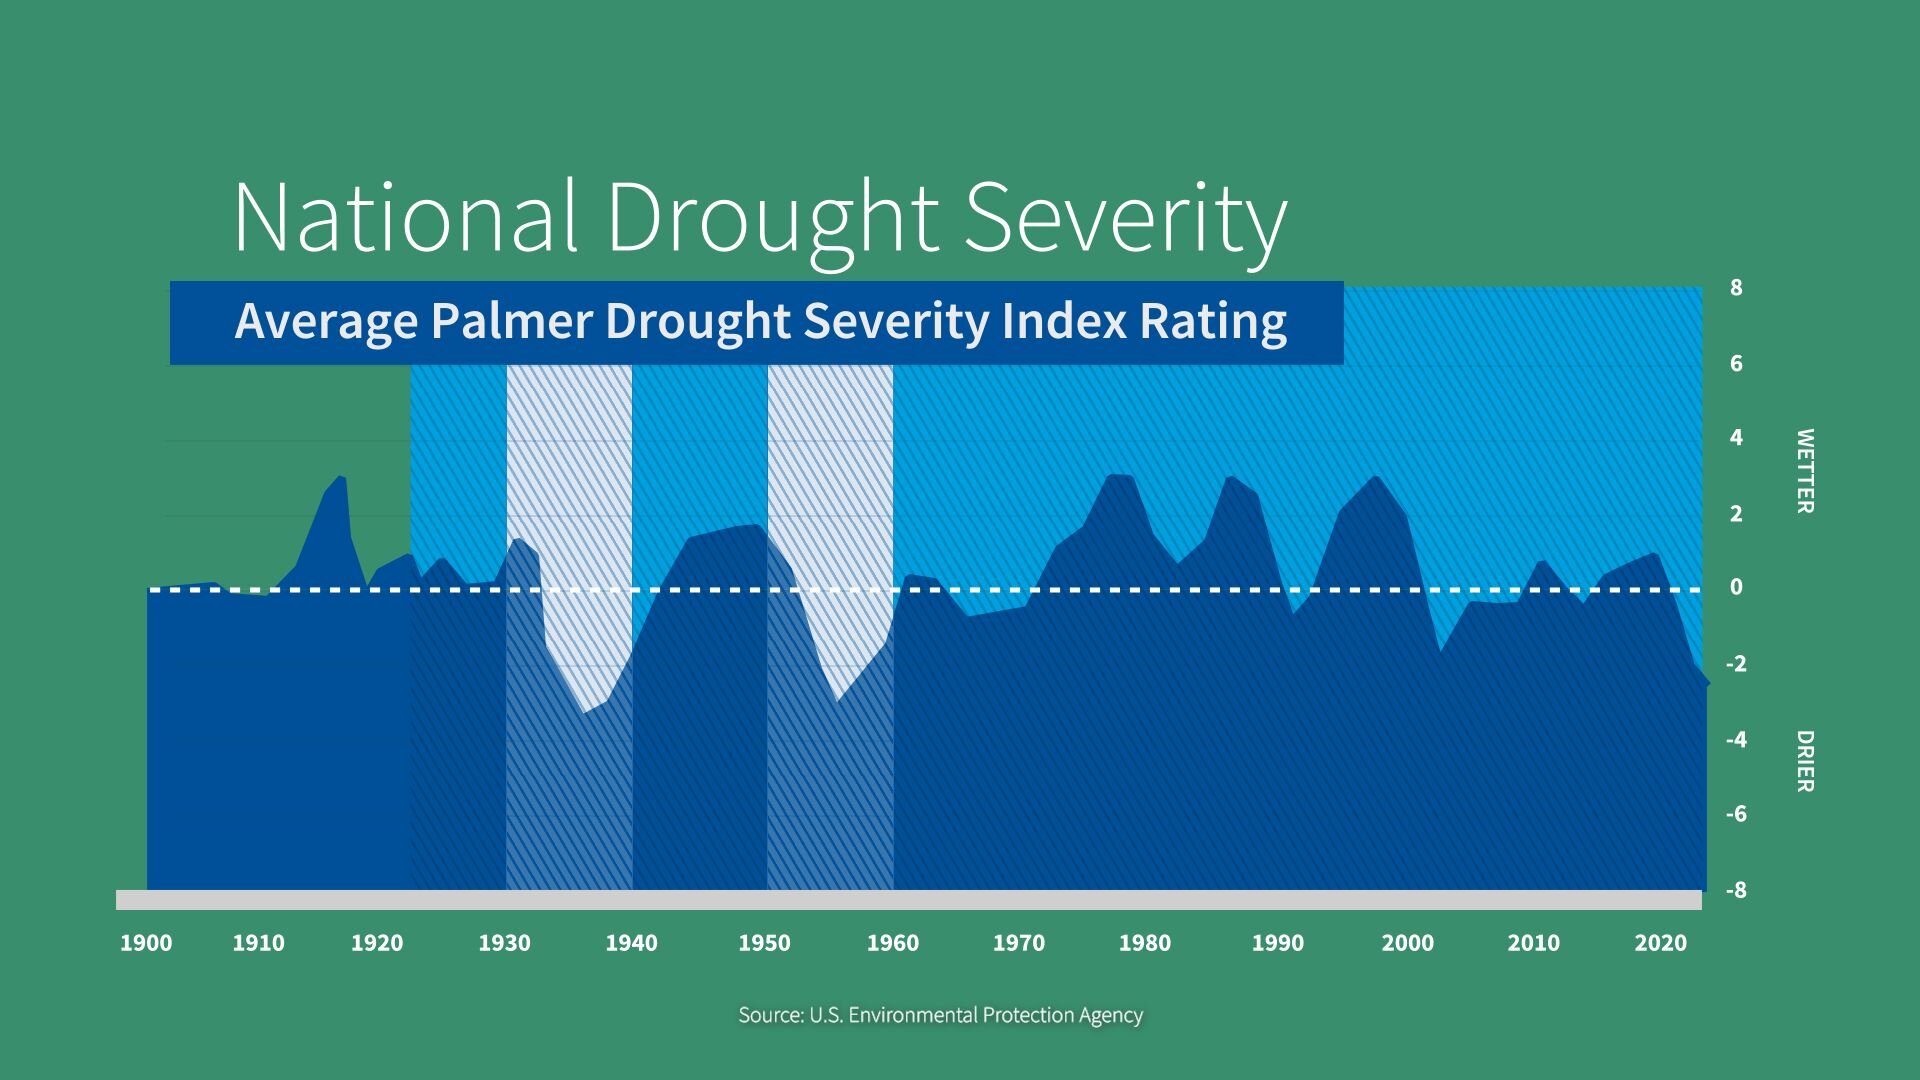
What about water? Well, you may have read news stories about drought conditions in certain parts of the US, but nationally, at least, the previous 50 years have generally been wetter than average. In the last century, the worst periods of drought in the US were the 1930s and 1950s.
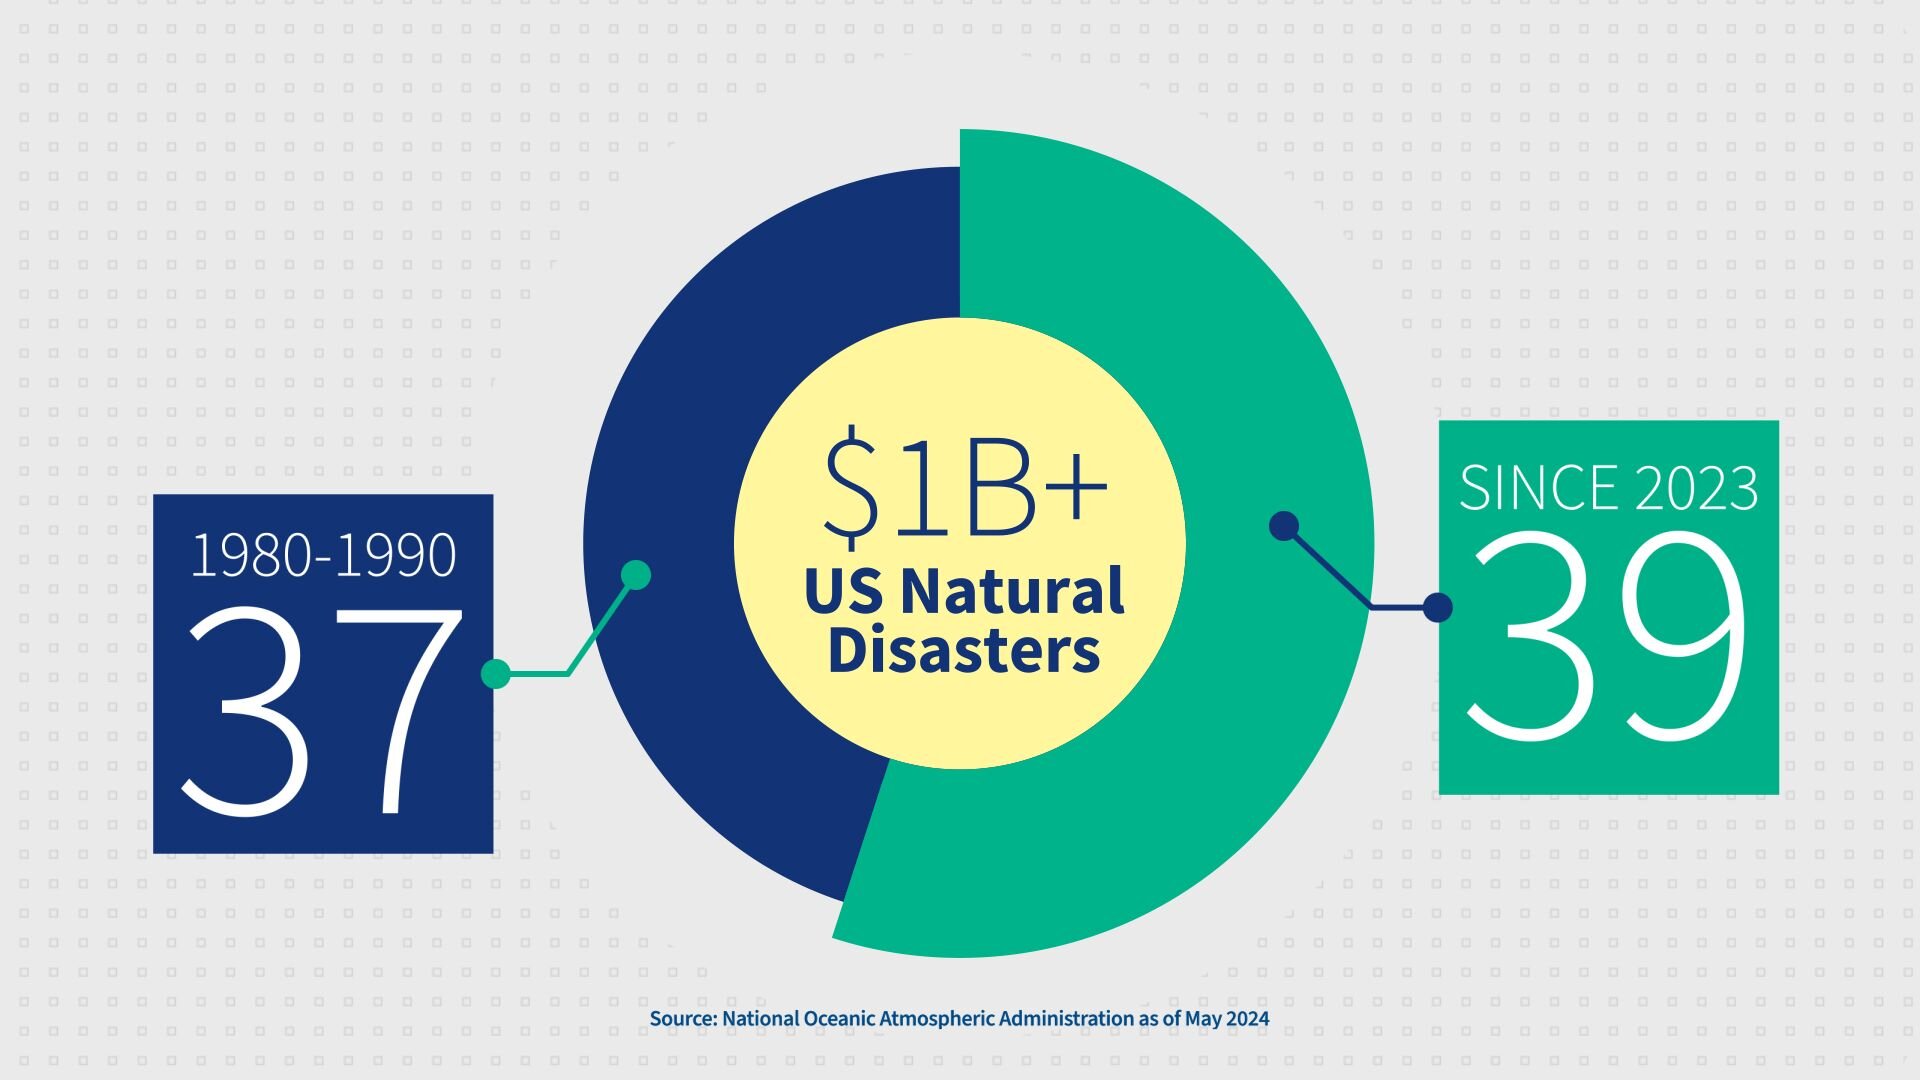
The US is seeing more natural disasters that cost over a billion dollars of damage, even after adjusting for inflation.
There have been 39 such disasters between 2023 and 2024, which is more than there were from 1980 to 1990 in total.
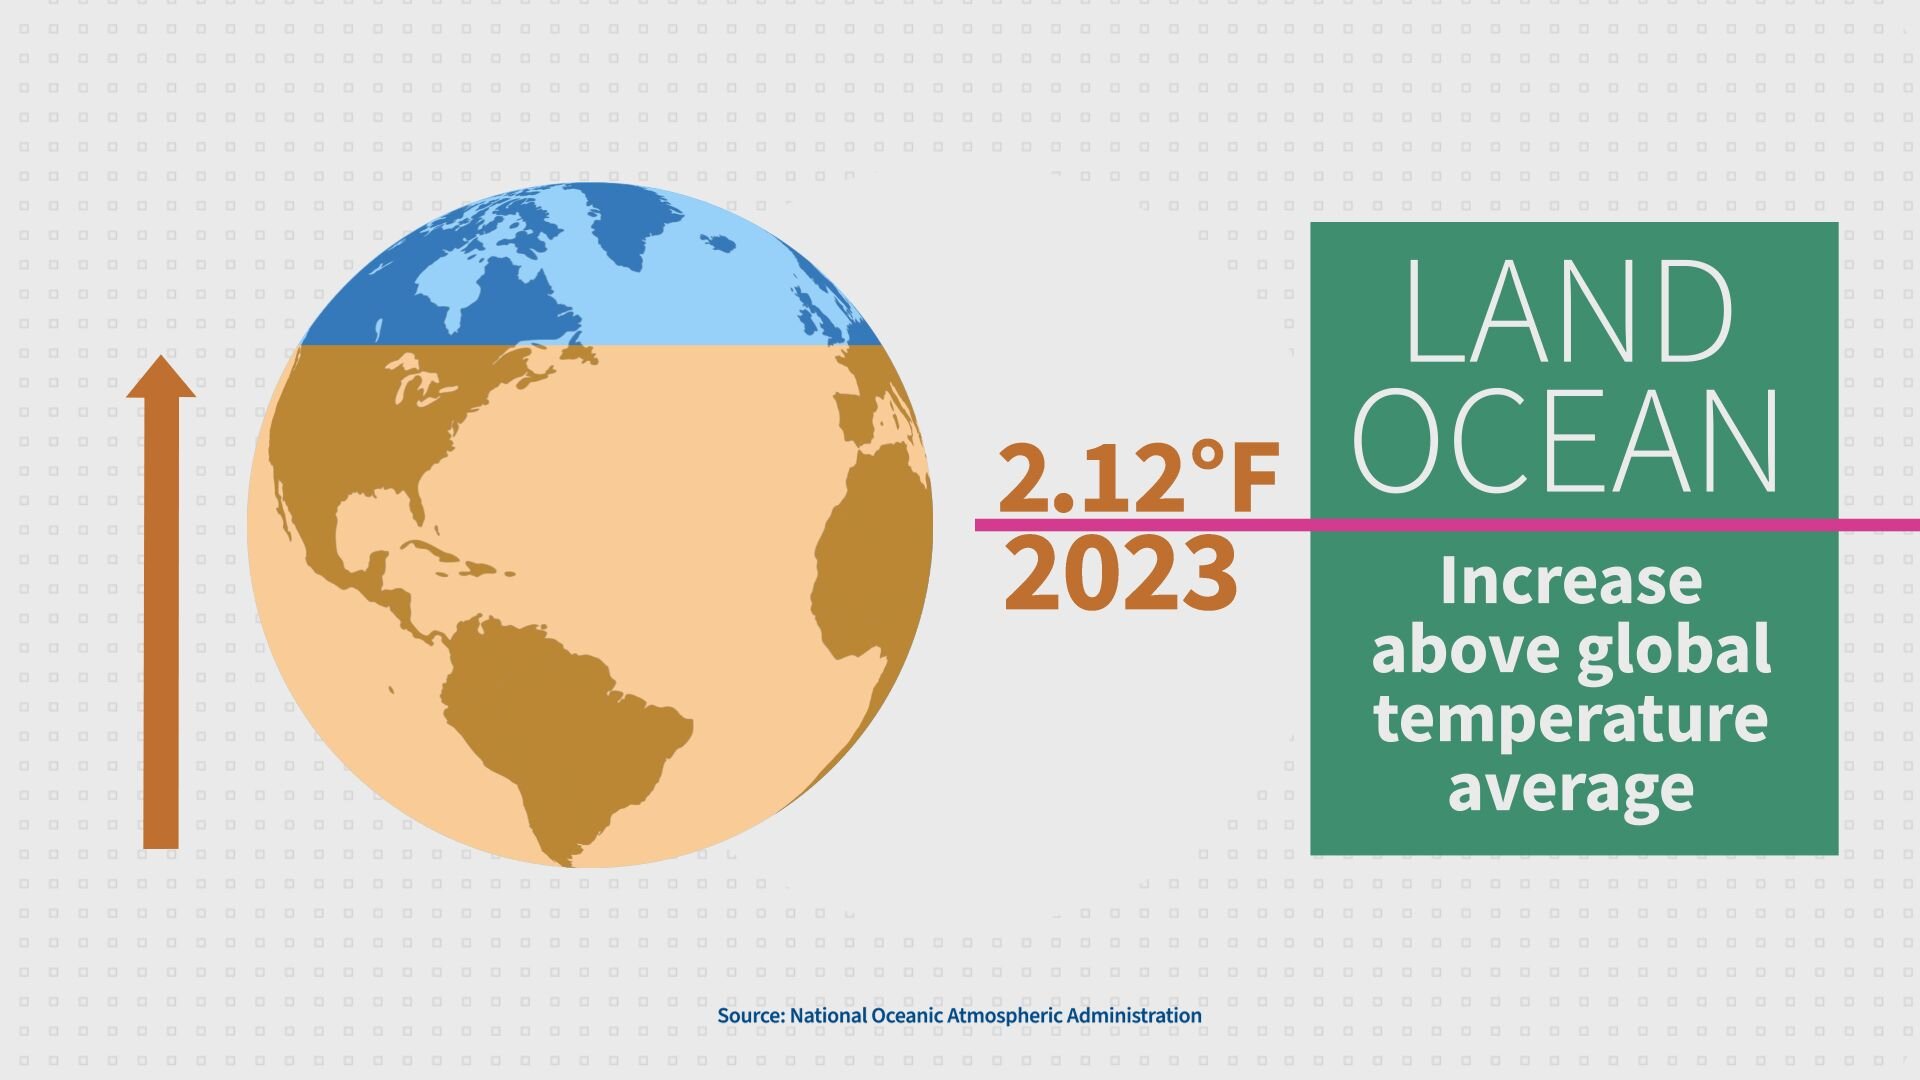
Data shows that the planet is experiencing higher temperatures. The Earth's average land and ocean surface temperature in 2023 set a record at 2.12 degrees Fahrenheit above the average of the last 100 years.
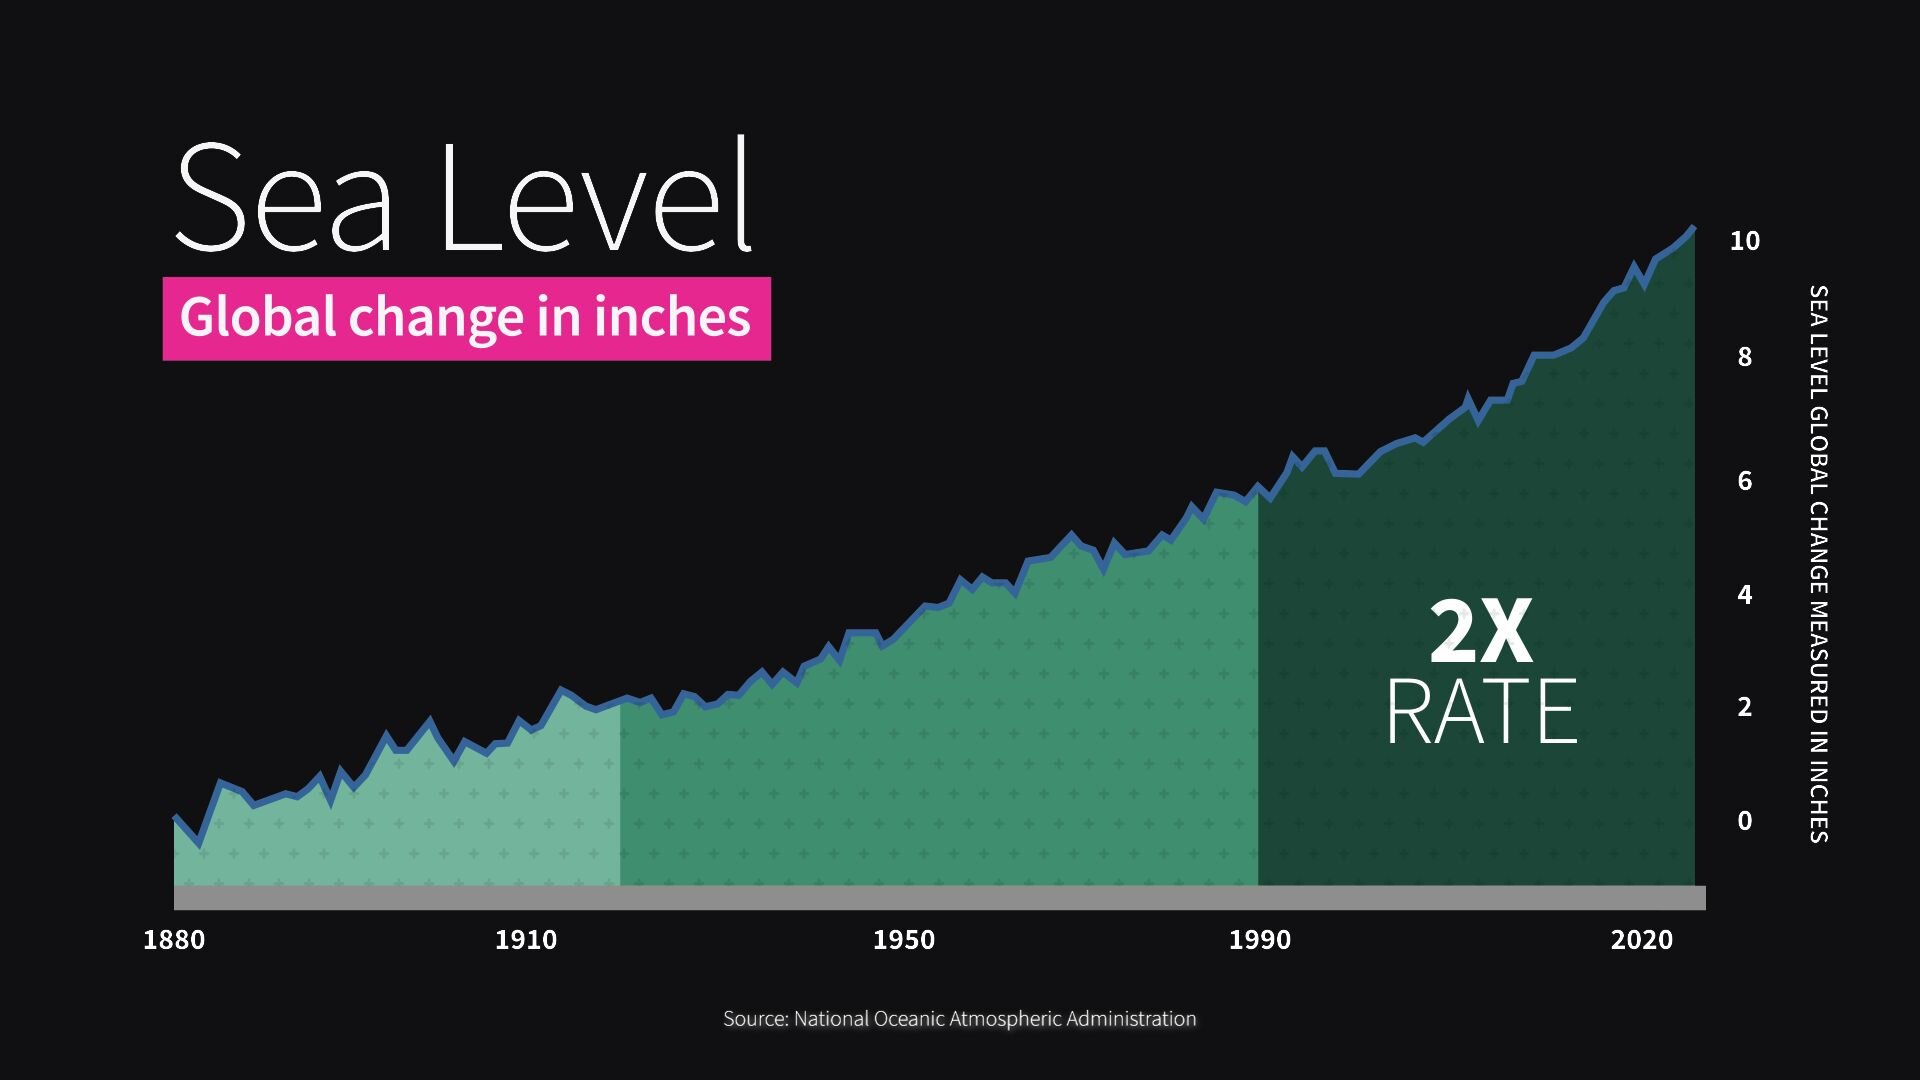
Global sea levels have risen 8-9 inches since 1880. The rate in the previous three decades is nearly double that of the last century.
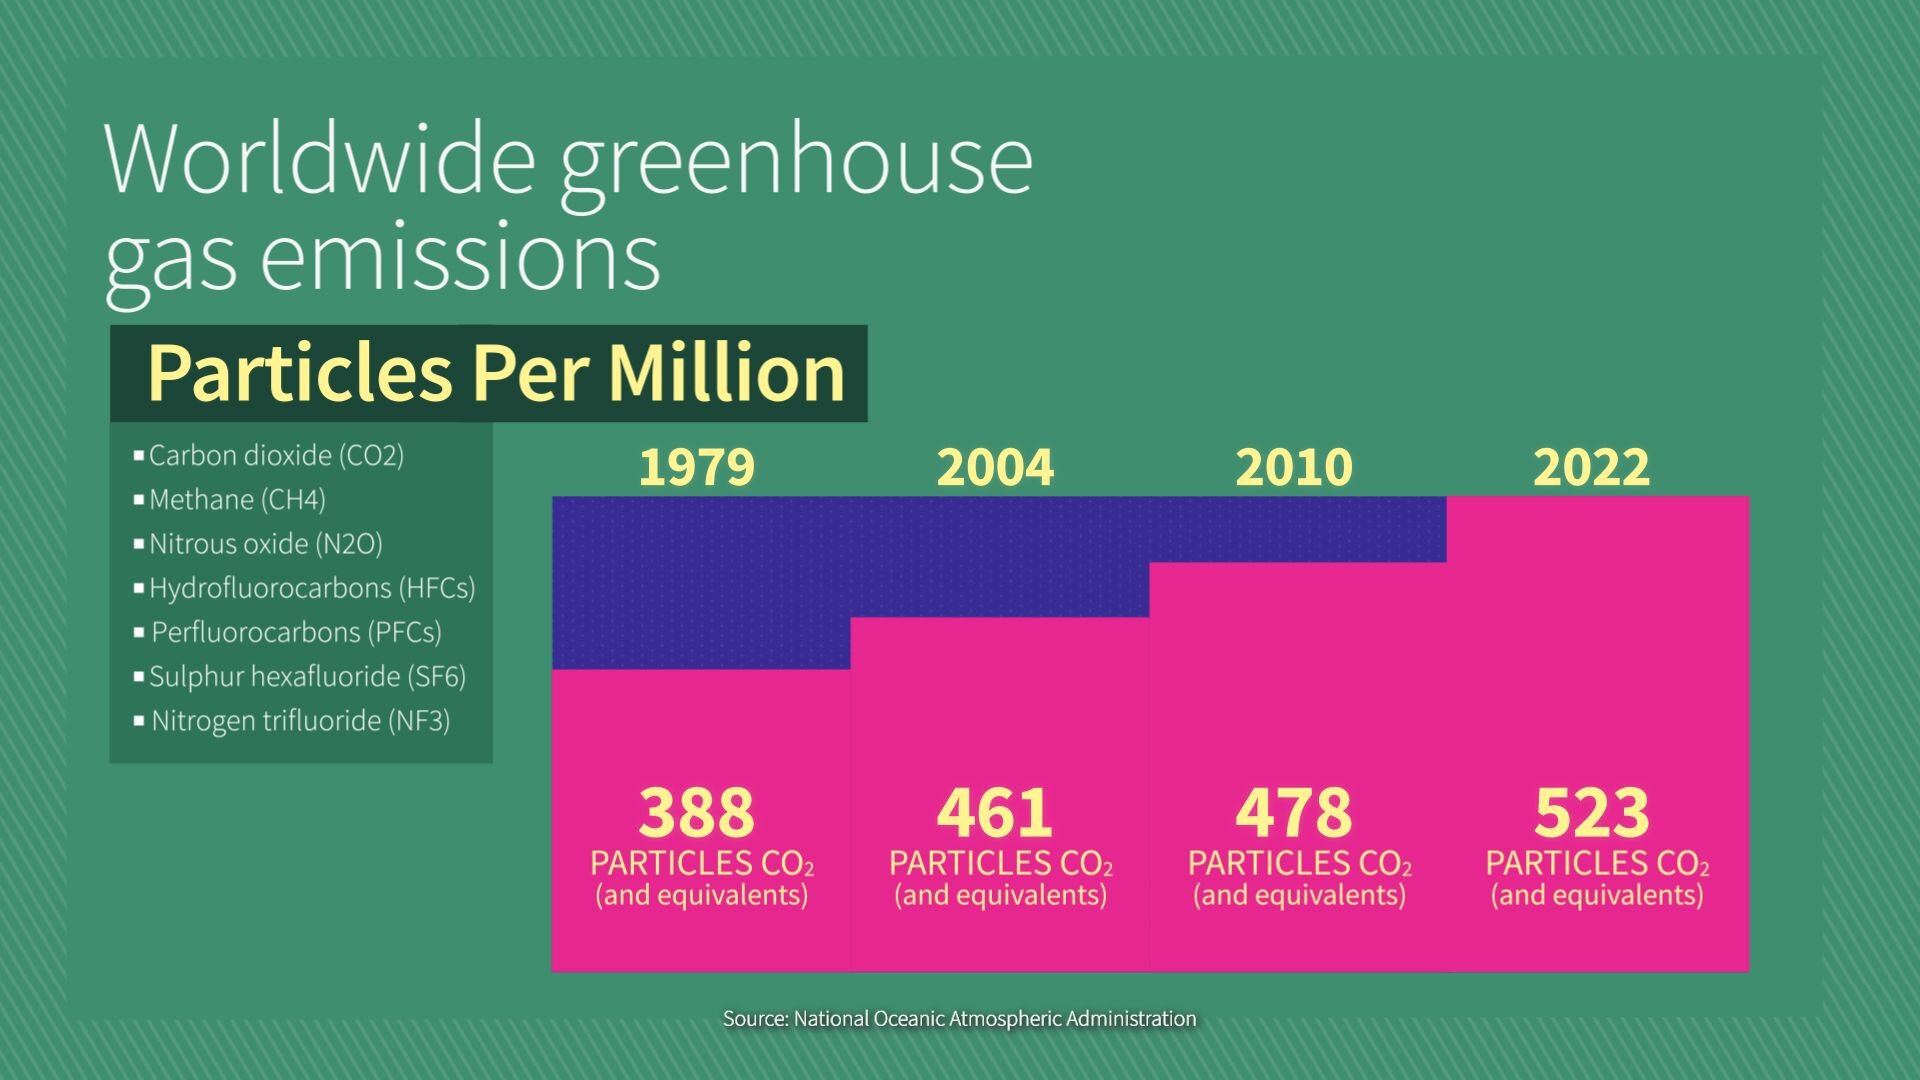
In 2022, worldwide, there were 523 particles of CO2 (and equivalents from other gasses like methane) per 1 million air particles. That number was only 388 in 1979, increased to 461 in 2004, and then 478 in 2010. Greenhouse gasses are a global phenomenon.
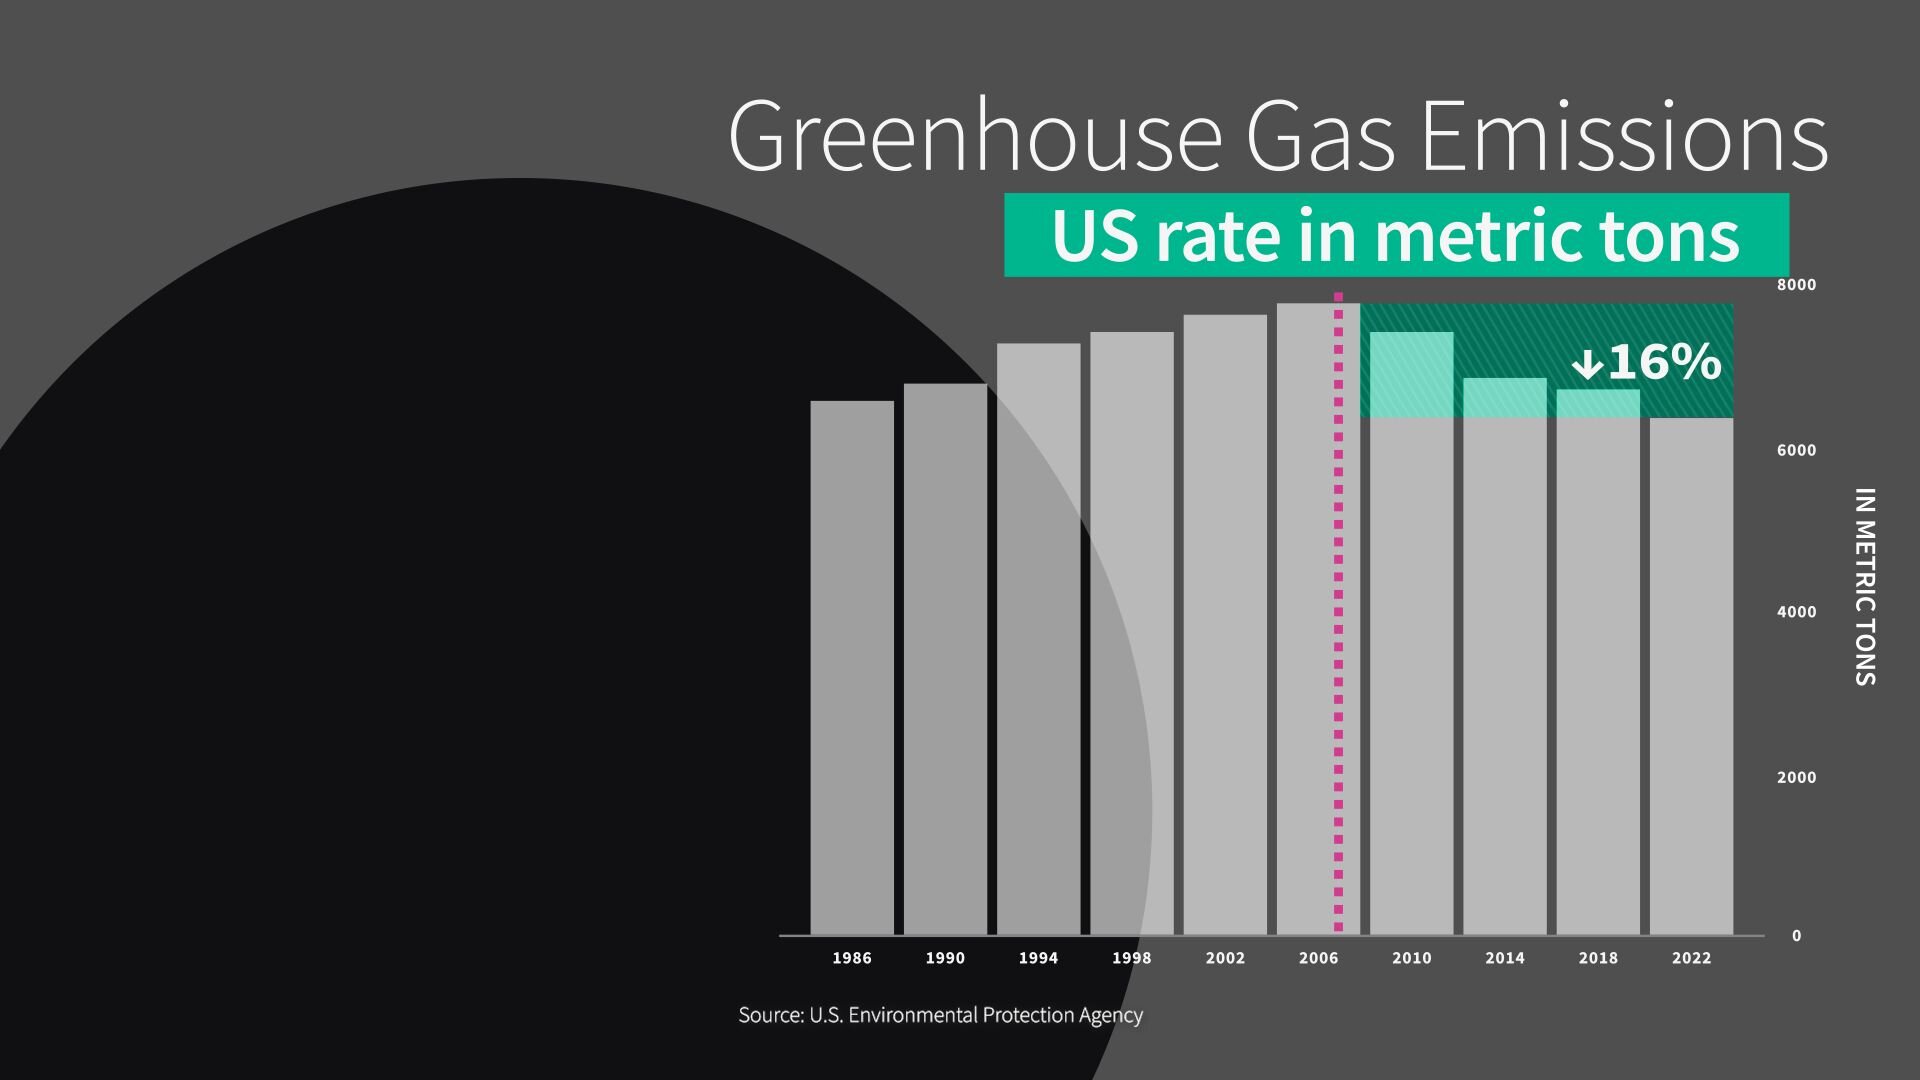
America's annual greenhouse gas emissions increased throughout the ‘90s, but peaked in 2007 and actually had declined by 16% by 2022 to about 6.3 million metric tons, which is the equivalent of nearly 20 Empire State Buildings.
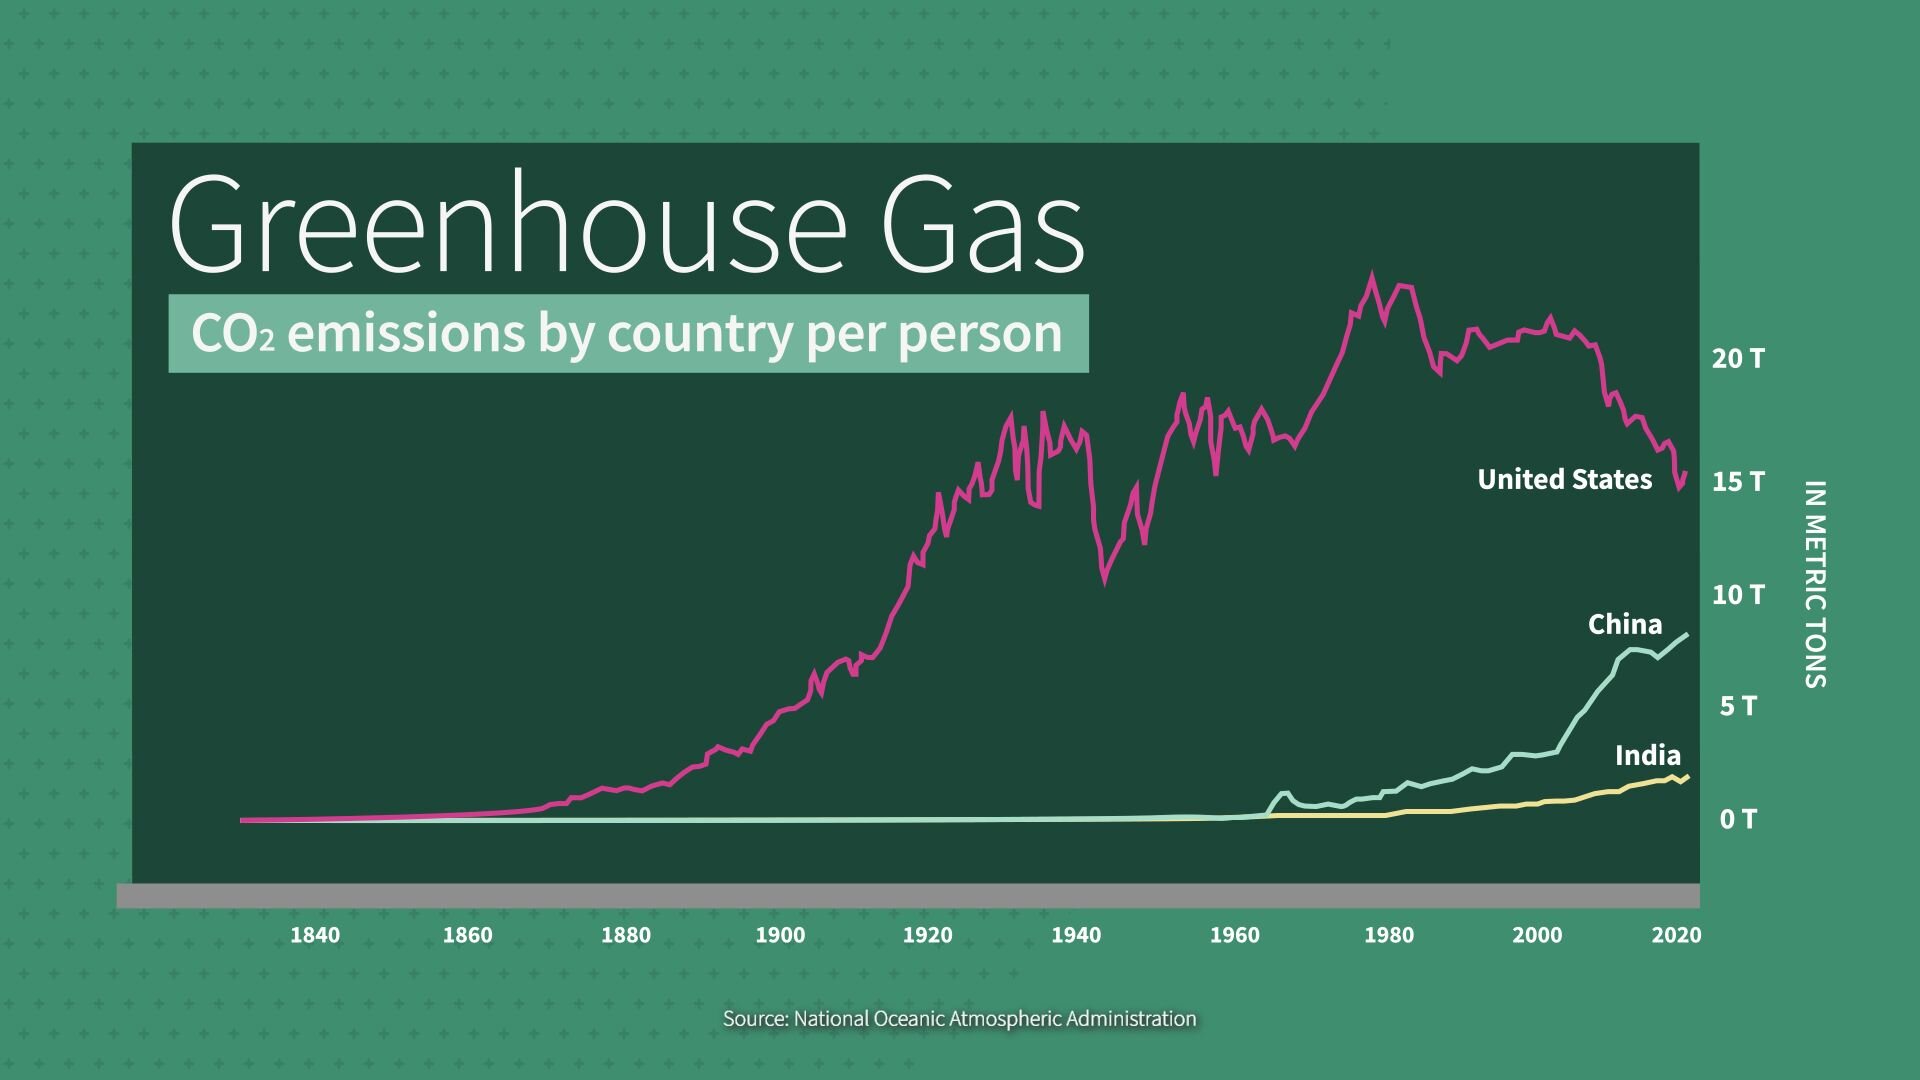
Historically, the United States has emitted more greenhouse gasses per person than any other country. These gasses can stay in the atmosphere for anywhere from a few years to thousands of years. But even as our emissions decline, others are increasing.
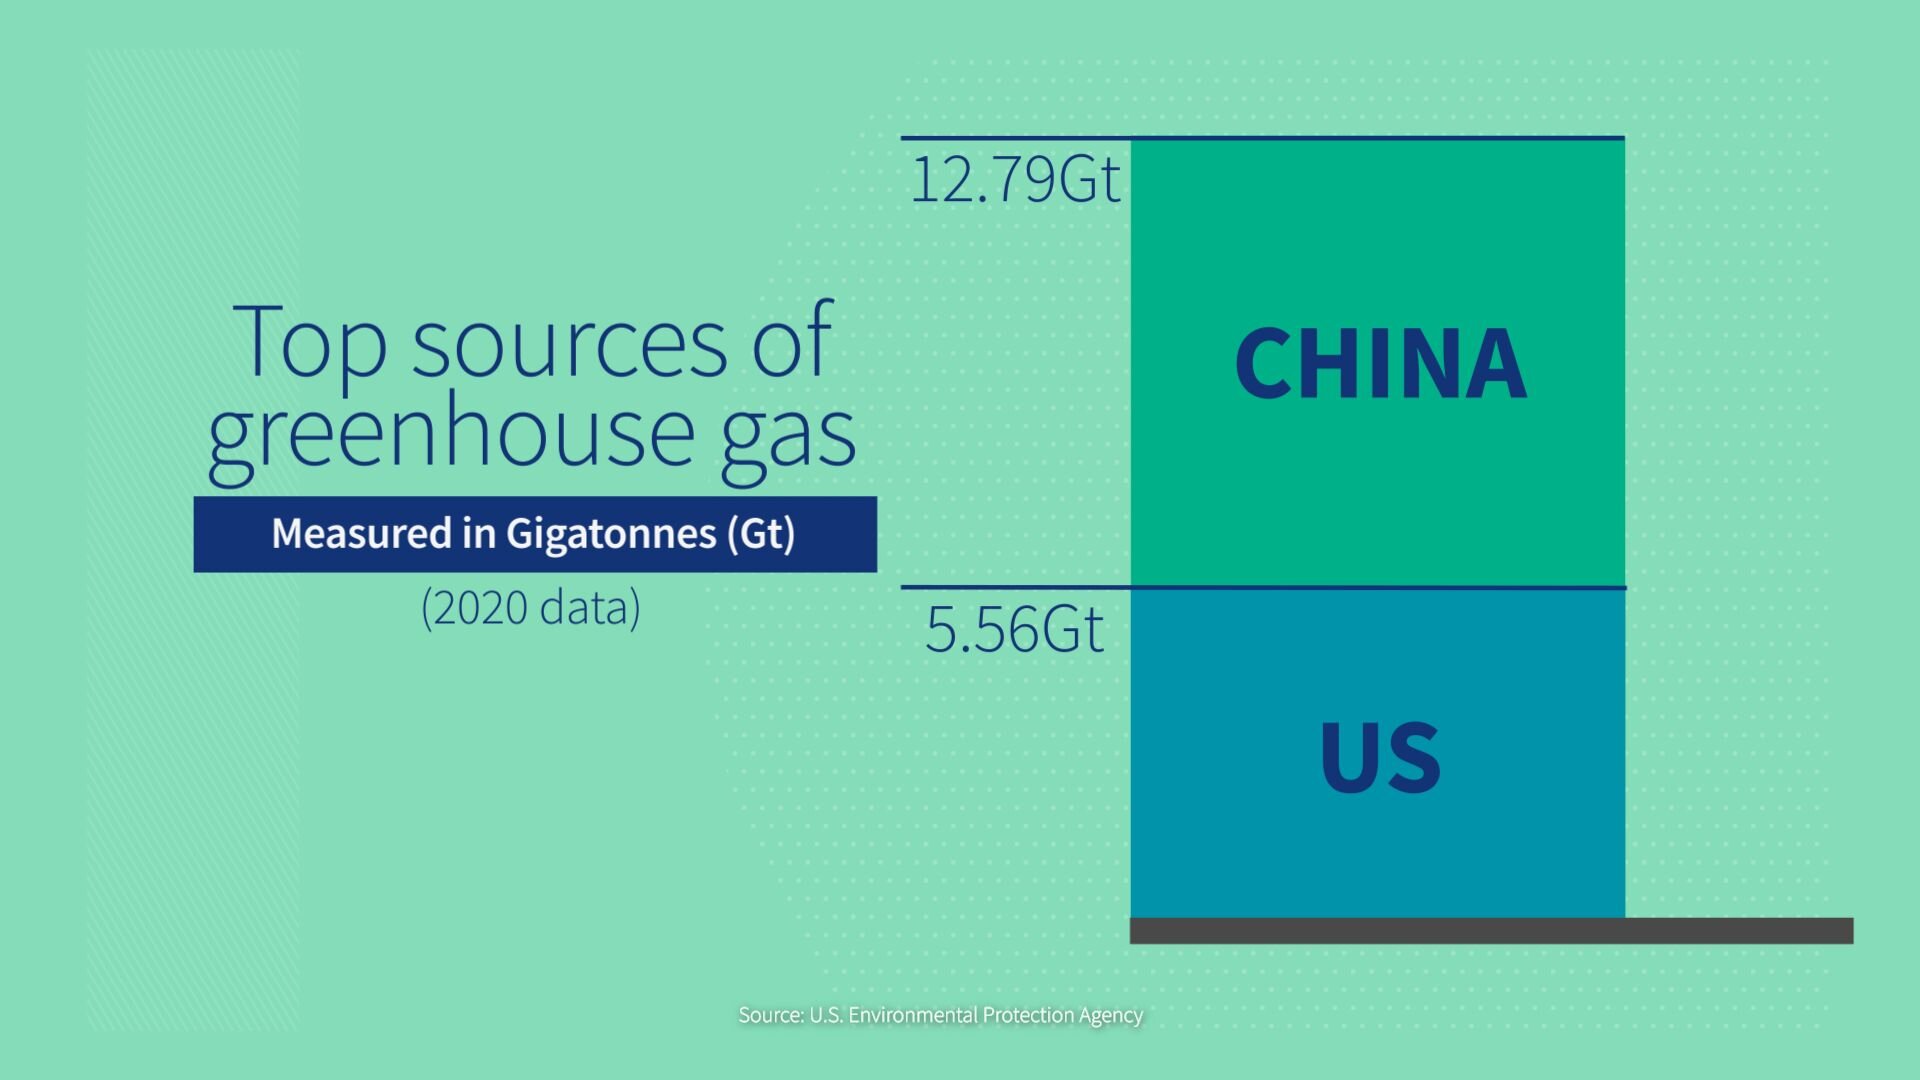
Today, China is the world’s top source of greenhouse gasses, emitting more than twice as much as the US did.
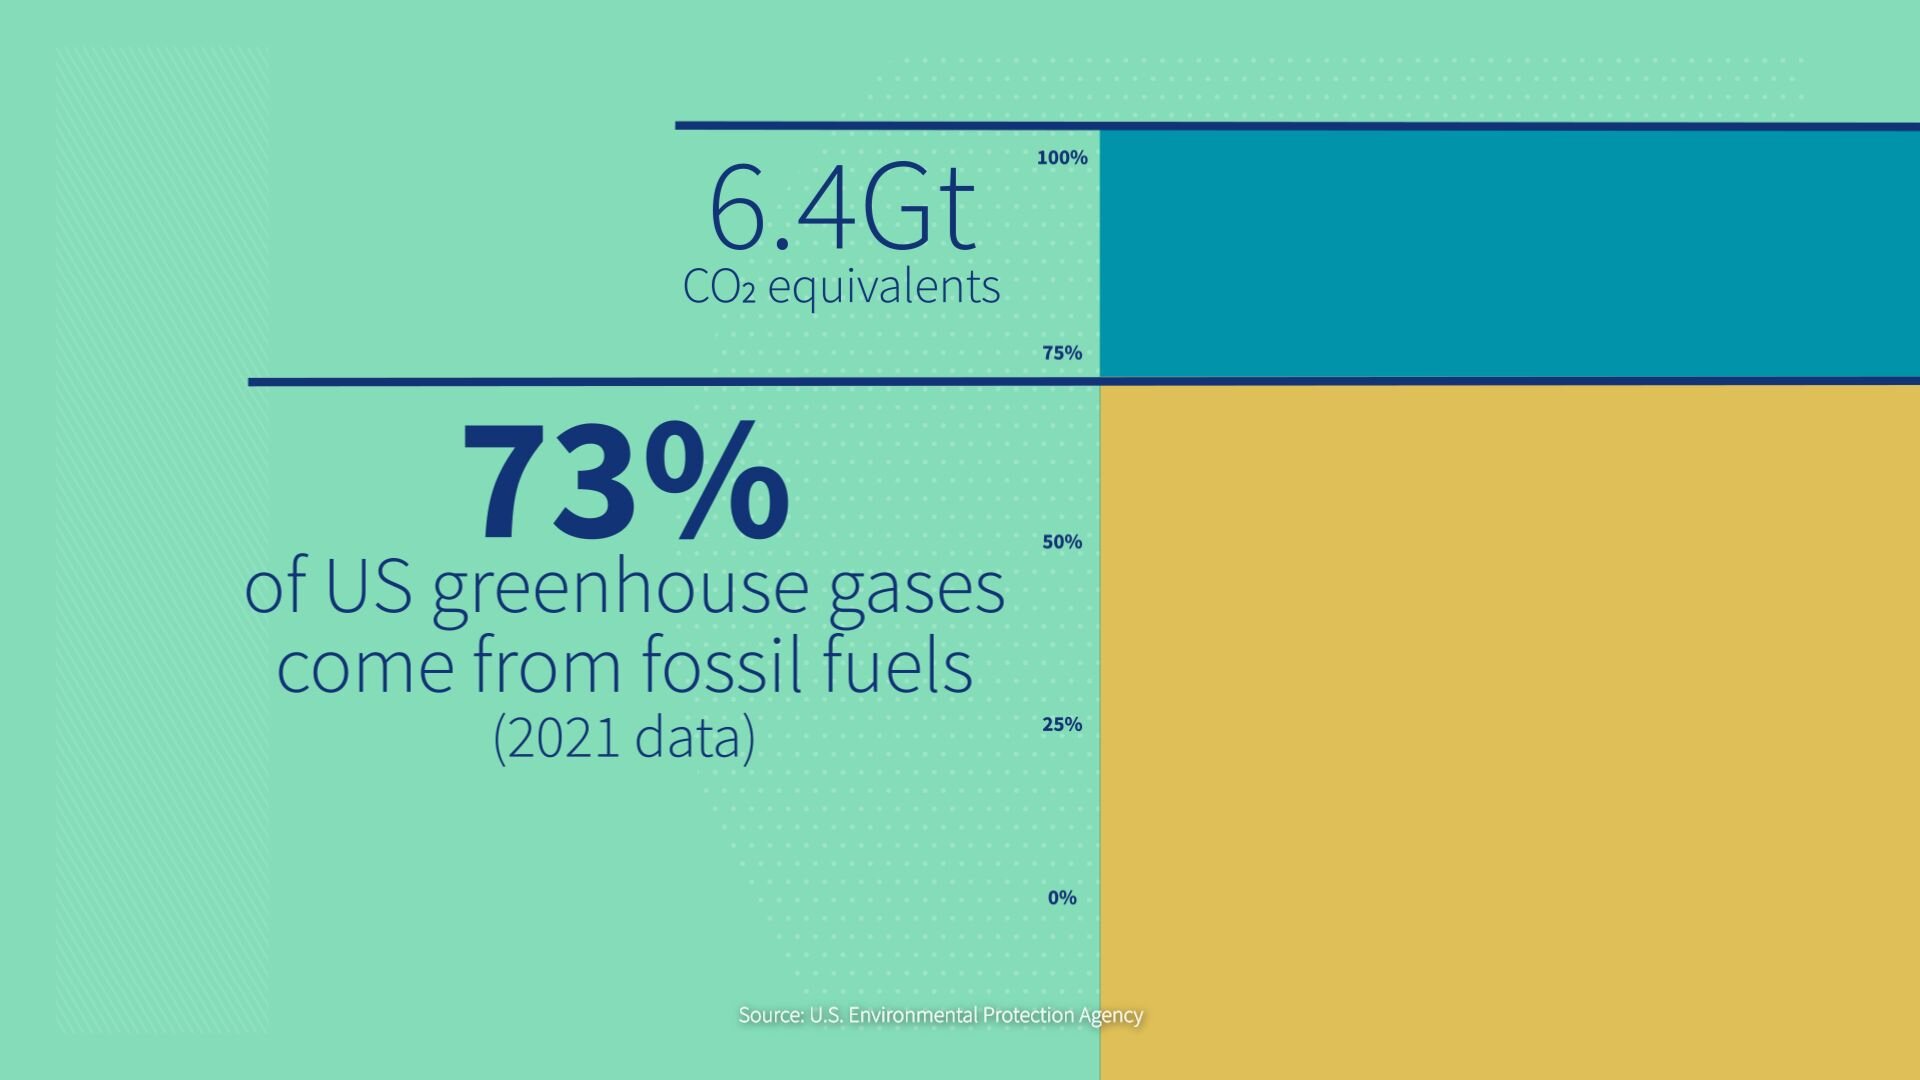
About 73% of America's greenhouse gasses result from our burning fossil fuels for energy, with the transportation sector being the most significant source of these emissions.
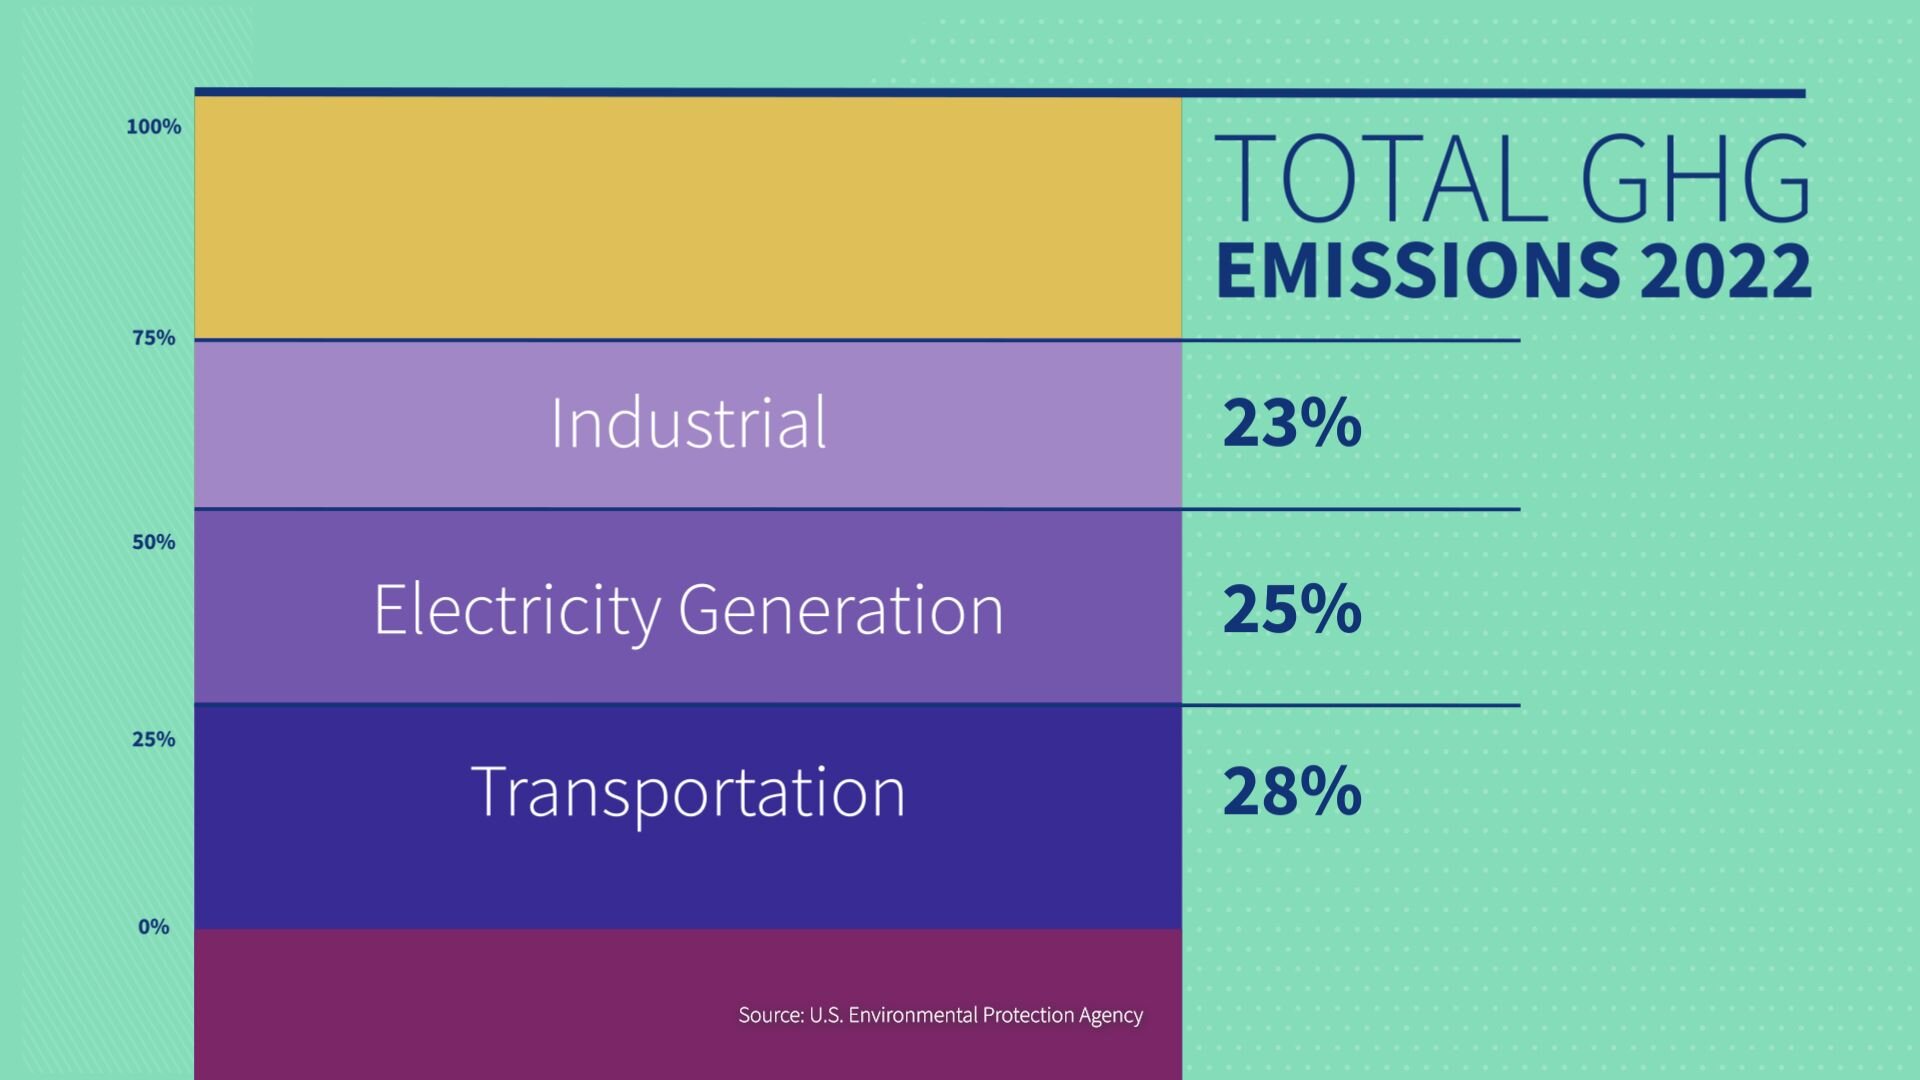
Transportation is responsible for 28% of total greenhouse gas emissions, followed by electricity generation at 25%, and the industrial sector, at 23%. The remainder came from residential use, commercial use, and agricultural emissions.
About 87% of these gases end up in our atmosphere.
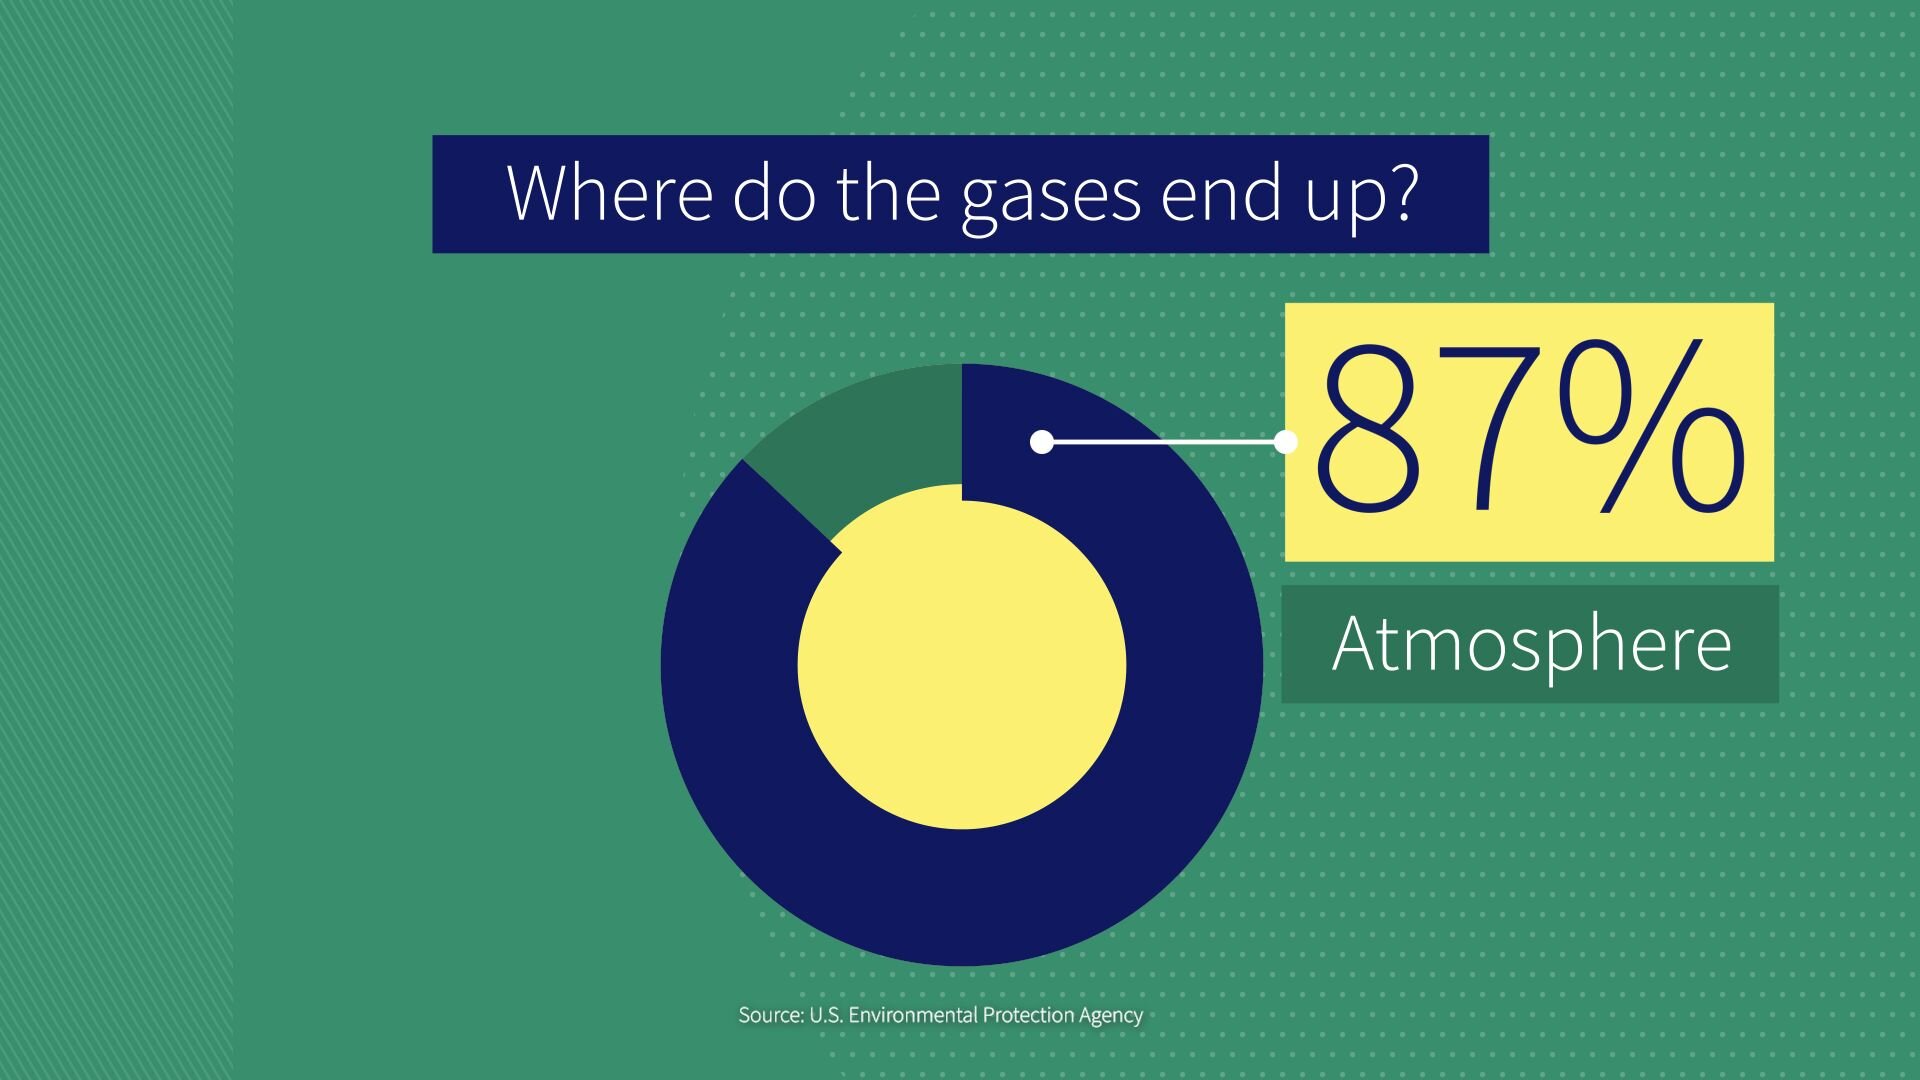
The other 13% is sequestered – or sucked back into the land by forest, plants, oceans, and various land management practices.

Some, including me, say act aggressively now on greenhouse gasses. Others say we have time to let technologies resolve these issues. Still, others reject there's any problem at all.
Global forces will also impact the picture. For example, Russia invading Ukraine, unrest in Venezuela reduced the amount of oil that the US imported from both countries.
Ultimately, it's up to you to learn the facts, reflect on varying opinions from scientists and economists about what might happen, and make up your own mind what risk we might take for the future, with our kids and grandkids and others who will come, versus the painful issues of today and the potential in rising energy prices.
This is Just the Facts from USAFacts.org. We share the government data. You decide what you believe.
Page sources and methodology
All of the data on the page was sourced directly from government agencies. The analysis and final review was performed by USAFacts.
Census Bureau
U.S. and World Population Clock
Energy Information Administration
Frequently Asked Questions and 22 others
Our government is complex. Our data doesn’t have to be.
Subscribe to our weekly newsletter to get data-backed answers to today’s most debated issues

