What is a O-1 visa?
19.5K
0.18%
The O-1 visa is a nonimmigrant visa for individuals who have demonstrated exceptional achievement in their field. It has two subcategories: the O-1A, for individuals with outstanding ability in the sciences, arts, education, business, or athletics; and the O-1B, for individuals with a strong record of achievement in the motion picture or television industry. Both subcategories require national or international recognition for their work, and the visa allows them to work in their area of expertise in the United States.
The length of stay for an O-1 visa is typically determined by the duration of the event or project, usually up to three years. Extensions can be granted in one-year increments with no limit on the number of extensions, provided the individual continues to meet the visa requirements.
What type of visa is an O-1 visa?
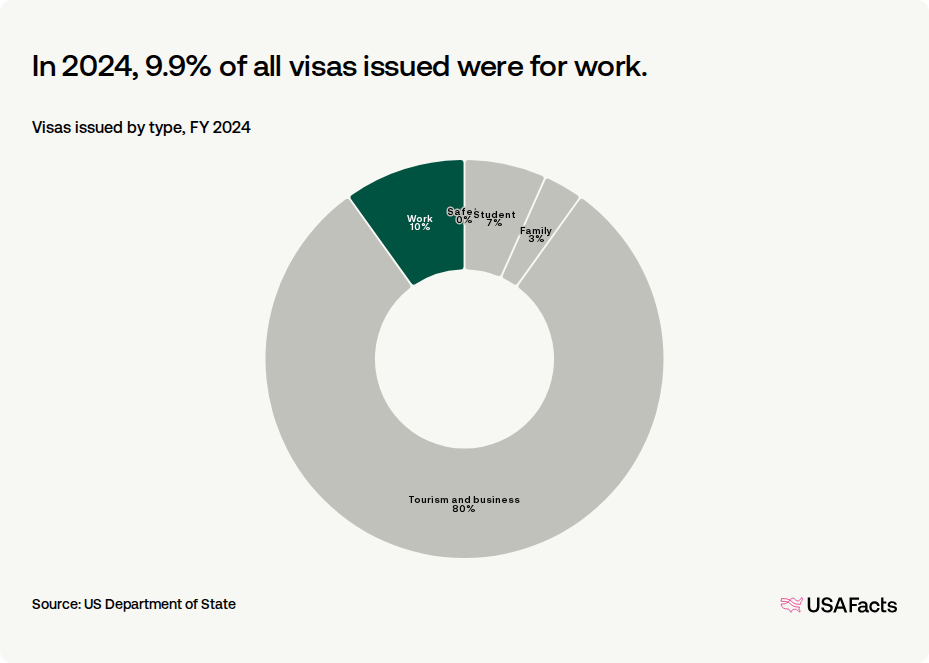
In 2024, 9.9% of all visas issued were for work.
Visas issued by type, FY 2024
How many O-1 visas are issued?
Get weekly insights
Subscribe for data-driven insights. No spin, just the facts.
The State Department does not maintain a cap on O-1 visas.
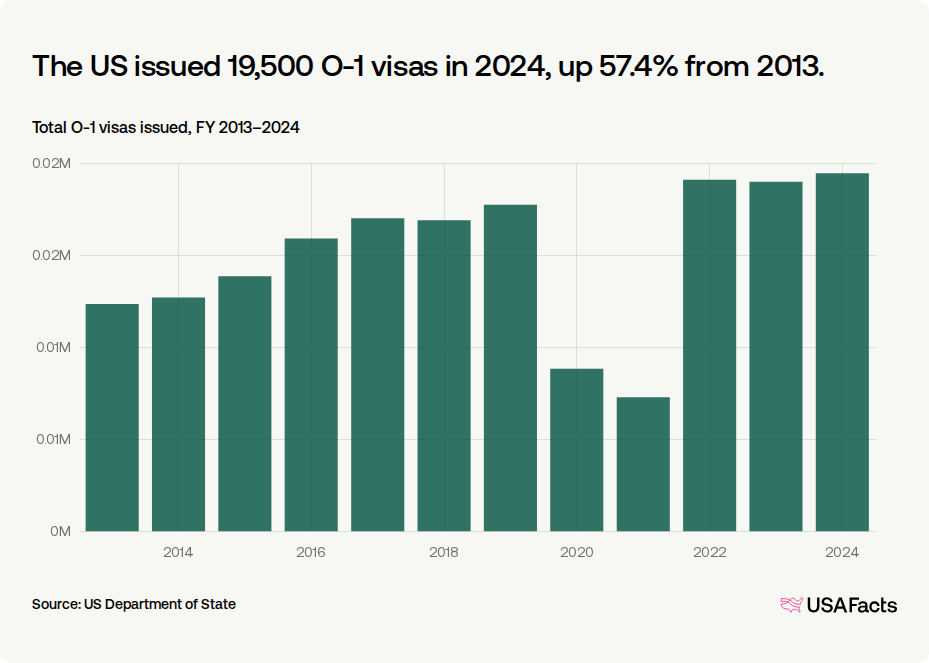
The US issued 19,500 O-1 visas in 2024, up 57.4% from 2013.
Total O-1 visas issued, FY 2013–2024
- Is deemed ineligible for the category
- Has a communicable disease or any illness that could pose a threat to safety
- Has been convicted of certain crimes
- Has been previously removed from the US
- Is a practicing polygamist
- Submitted an incomplete application
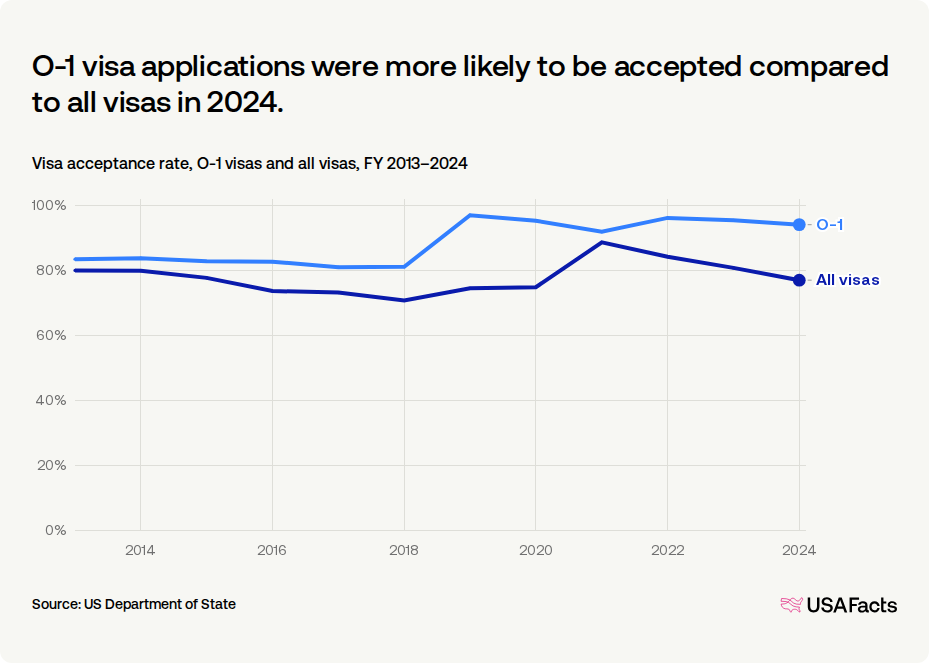
O-1 visa applications were more likely to be accepted compared to all visas in 2024.
Visa acceptance rate, O-1 visas and all visas, FY 2013–2024
Who comes to the US on an O-1 visa?
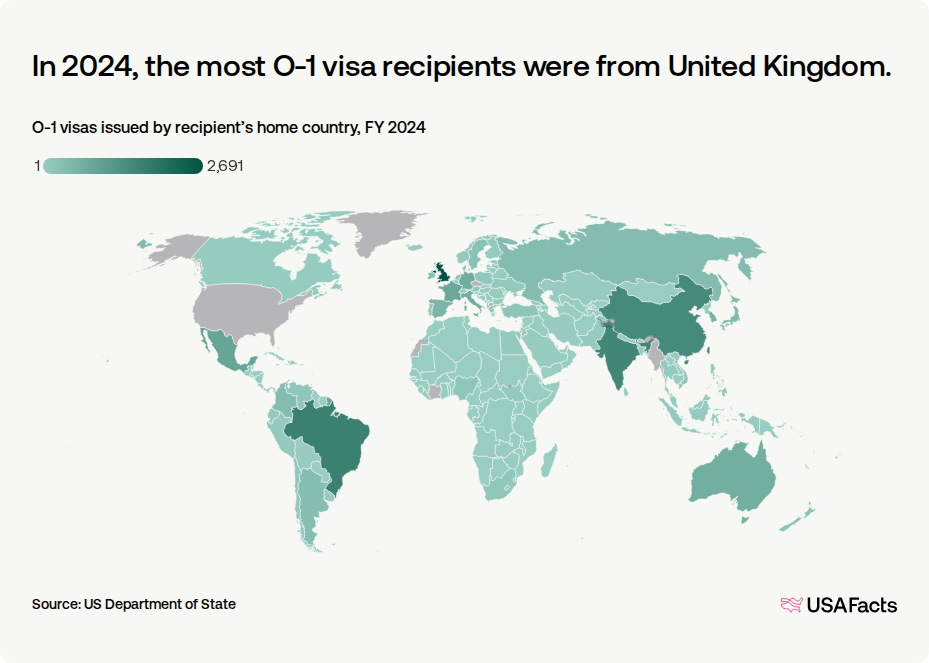
- United Kingdom (2,691)
- Brazil (1,668)
- India (1,566)
- China (1,476)
- Mexico (880)
In 2024, the most O-1 visa recipients were from United Kingdom.
O-1 visas issued by recipient’s home country, FY 2024
- Iceland (0.06 per 1,000 people)
- Monaco (0.06)
- Saint Kitts and Nevis (0.05)
- Ireland (0.05)
- Grenada (0.05)
Keep exploring
Methodology
USAFacts standardizes data, in areas such as time and demographics, to make it easier to understand and compare.
Page sources
USAFacts endeavors to share the most up-to-date information available. We sourced the data on this page directly from government agencies; however, the intervals at which agencies publish updated data vary.

