What is a visa?
Refreshed annually
A visa is an official document the federal government issues to allow a foreign national to travel to a port of entry and request permission to enter for a specific purpose. While a visa does not guarantee entry, it indicates that the person has met the requirements for the type of visit they are requesting.
In FY 2024, the US issued 11 million visas.
In FY 2024,
11M
visas were issued by the US
In FY 2024,
99.8%
of visas issued were nonimmigrant visas
In FY 2024,
0.22%
of visas issued were immigrant visas
The State Department has two main visa categories: immigrant and nonimmigrant. Immigrant visas are for people who intend to stay in the United States permanently. Nonimmigrant visas are for those who stay temporarily.
What kinds of visas are there?
There several immigrant and nonimmigrant visa subcategories for specific purposes.
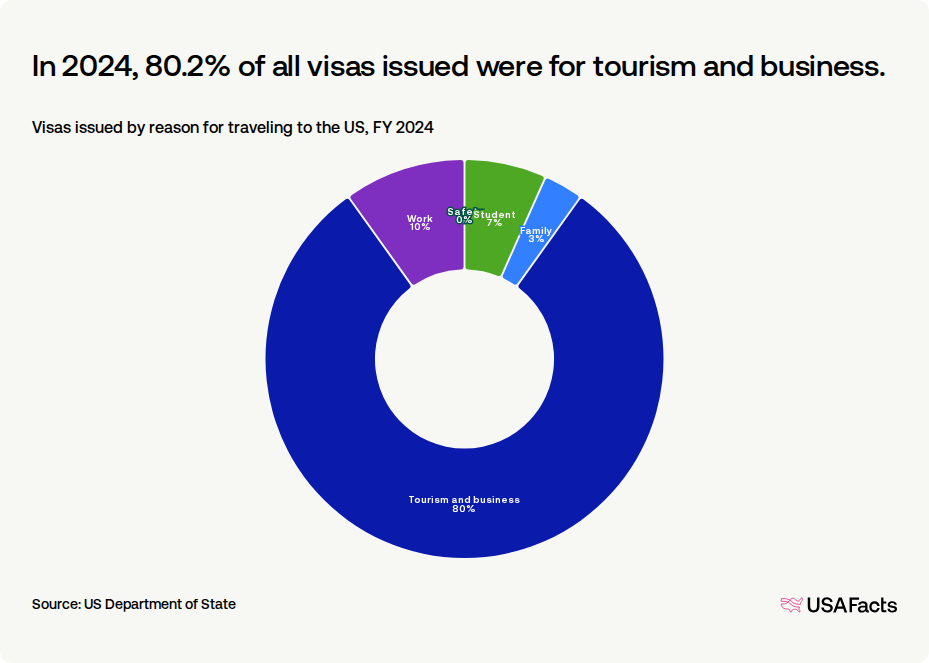
- Work visas allow foreign nationals to enter the US for employment. Examples include the H-1B (specialty occupations) or H-2A (temporary agricultural workers).
- Tourism/business visas are for short-term visits such as travel, medical care, or business meetings. The most common is the B1/B2 visitor visa.
- Student visas are for people enrolled in academic or vocational study in the US. The F-1 visa is the most common, covering academic programs, while the M-1 covers vocational or technical training.
- Family visas allow people to move permanently to the US, usually sponsored by a family member or employer. This includes visas leading to a green card, such as immediate relative visas or family preference visas.
- Safety visas are issued to crime victims.
Visas don’t include permanent residency cards or applications for asylee or refugee status.
In 2024, 80.2% of all visas issued were for tourism and business.
Visas issued by reason for traveling to the US, FY 2024
How many visas are issued?
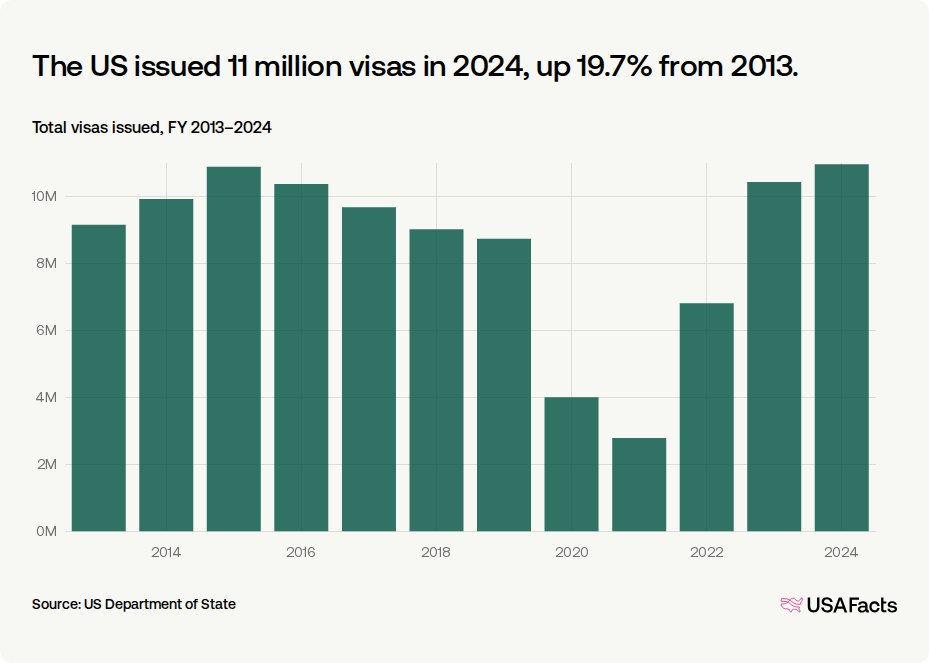
The State Department issued 11 million visas in 2024. That was up 19.7% from the 9.16 million issued in 2013, the earliest year of available data.
Get weekly insights
Subscribe for data-driven insights. No spin, just the facts.
Issued visas fell by 68% during the pandemic, down from 8.7 million in 2019 to 2.8 million in 2021. By 2023, totals had returned to above pre-pandemic levels.
The US issued 11 million visas in 2024, up 19.7% from 2013.
Total visas issued, FY 2013–2024
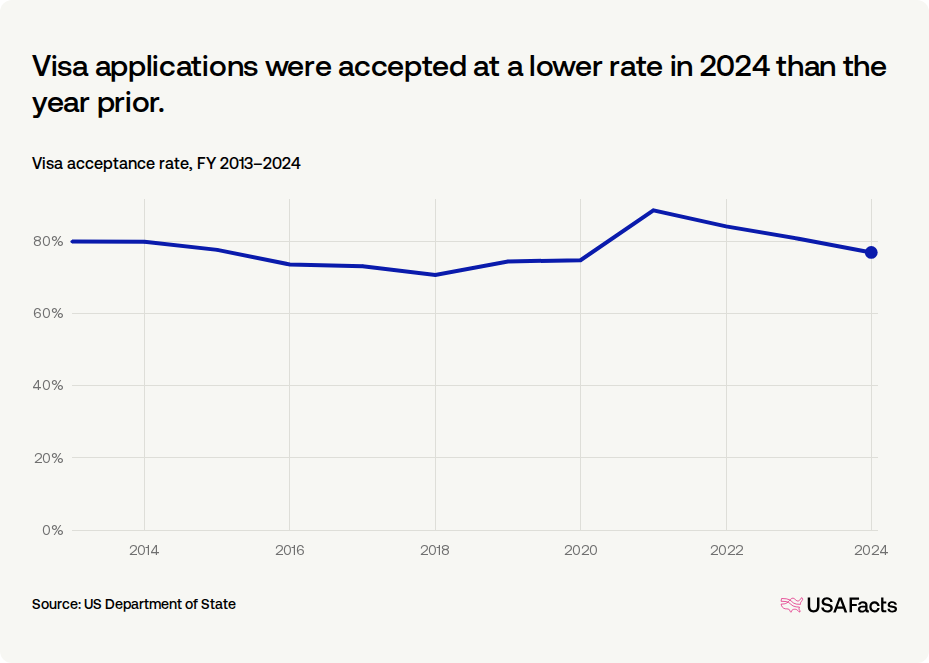
Of all visa applications processed in 2024, 77.0% were accepted. That acceptance rate was down from a recent peak of 88.7% in 2021.
Visas might be denied for a variety of reasons, including if the applicant:
- Is deemed ineligible for the category
- Has a communicable disease or any illness that could pose a threat to safety
- Has been convicted of certain crimes
- Has been previously removed from the US
- Is a practicing polygamist
- Submitted an incomplete application
Visa applications were accepted at a lower rate in 2024 than the year prior.
Visa acceptance rate, FY 2013–2024
Who comes to the US on a visa?
For the 6th straight year, more visa recipients came from Mexico than any other country in 2024 — the country’s 2.41 million recipients made up 22% of total visas issued. The next-highest populations came from India (1,374,775 or 12.5%) and Brazil (1,172,518 or 10.7%).
The countries with the most visa recipients overall were:
- Mexico (2,408,789)
- India (1,374,775)
- Brazil (1,172,518)
- China (818,727)
- Colombia (473,250)
In 2024, the most visa recipients were from Mexico.
Visas issued by recipient’s home country, FY 2024

The countries with the highest number of visa recipients compared to their overall population were:
- Saint Kitts and Nevis (66 per 1,000 people)
- Dominica (44)
- The Bahamas (41)
- Jamaica (40)
- Barbados (40)
Overall, people from 198 different countries and territories received visas.
Keep exploring
Methodology
USAFacts standardizes data, in areas such as time and demographics, to make it easier to understand and compare.
Page sources
USAFacts endeavors to share the most up-to-date information available. We sourced the data on this page directly from government agencies; however, the intervals at which agencies publish updated data vary.

