Who has health insurance? Are rates going up?
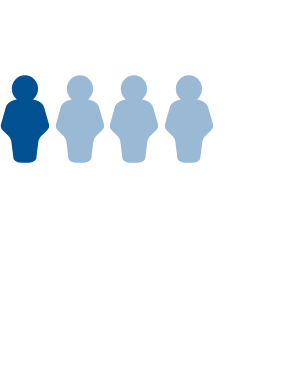
Young adults ages 19 to 25 are the most likely to be uninsured of any age group: 14.3% of them were uninsured in 2024.
According to the Census Bureau 92.0% of people in the US had health insurance in 2024. In the past 10 years, the share of people covered by health insurance has been above 90%.
Health insurance provides Americans with access to healthcare and offers financial coverage during medical emergencies. Most Americans are insured, but insurance rates still change from year to year due to economic trends (such as those related to COVID-19), demographic shifts (including an aging population), and public policy changes.
How common are private and public health insurance plans?
The Census Bureau estimates that 66.1% of Americans were covered by a private health insurance plan in 2024, while 35.5% were covered by a public plan. (Yes, that’s more than 100%. The categories are not mutually exclusive and some people have both plan types.)
Employment-based plans are the nation’s most common type of insurance: 53.8% of Americans were insured through an employer or labor union in 2024. People can also purchase plans on their own, either directly from an insurance company or through a government marketplace like HealthCare.gov.
In 2024, 10.7% of Americans purchased their own healthcare. Another 2.8% were covered by Tricare, the insurance plan for military members and their families.
Public insurance plans include Medicare for people 65 and over, Medicaid for low-income individuals, and Department of Veterans Affairs (VA) coverage. In 2024, 19.1% of Americans used Medicare, 17.6% had Medicaid, and 1.2% had VA coverage. People can also be simultaneously eligible for Medicare and Medicaid — 12 million Americans, or about 15% of all Medicaid enrollees, are enrolled in both programs.
How did health insurance rates change from 2023 to 2024?
From 2023 to 2024, the share of people with public health insurance decreased from 36.3% to 35.5%. This is partly driven by a smaller share of people using Medicaid (dropping from 18.9% to 17.6% of Americans).
The share of people with private health insurance increased from 65.4% to 66.1%, driven by direct purchase and Tricare.
How do uninsured rates differ by race and ethnicity?
Hispanic adults younger than 65 have the nation’s highest uninsured rate. In 2024, 23.0% of Hispanic adults were uninsured, more than twice the national adult rate of 11.0%. Black adults are also more likely to be uninsured, with an uninsurance rate of 12.3%.
Asian adults were uninsured at a rate of 6.9%, and white, non-Hispanic adults had the lowest uninsured rate at 6.8% in 2024.
The trends were similar for children in each race or ethnicity group, though children have lower uninsured rates generally.
How do uninsured rates differ by age?
Children (from less than a year old through age 18) and older adults (65 and older) are more likely to have health insurance than working-age adults (19 to 64). In 2024, 1.0% of older adults and 6.1% of children were uninsured, compared with 11.0% of adults between 19 and 64.
The Census Bureau attributes this gap to public insurance plans and provisions in health insurance laws. Seniors can receive health insurance through Medicare.
Children often receive insurance through their parents’ plans, and public programs for children in lower-income families such as Medicaid and the Children’s Health Insurance Program (CHIP).
Young adults may also receive coverage from their parents’ insurance through age 25 (though people between 19 and 25 had the highest uninsured rates of any age group in the census data).
How do uninsured rates differ by state?
In 2024, the share of people without health insurance ranged from 2.8% in Massachusetts to 16.7% in Texas. Nine states had uninsured rates above 10% in 2024, while six states plus Washington, DC, had rates at or below 5%.
The Census Bureau notes that states that expanded access to Medicaid under the Affordable Care Act collectively have lower uninsured rates for children and working-age adults compared with states that have not expanded access.
In 2024, 4.6% of children and 9.2% of working-age adults lacked health insurance across all states with expanded Medicaid access. In states that hadn’t, those numbers almost doubled, to 9.4% of children and 15.7% of working-age adults. The states without expanded access at the time of the survey were Alabama, Florida, Georgia, Kansas, Mississippi, South Carolina, Tennessee, Texas, Wisconsin, and Wyoming.
Learn more about health and access to healthcare, and get the data directly in your inbox by signing up for our email newsletter.
