How much do households in the US spend on rent?
Refreshed annually
About 32.8% of their income in 2025. This is measured by comparing median, or average, rent and median monthly income for renting households. Median rent, including utilities, was about $1,557 per month. Median monthly income among renting households was about $4,754 per month.
$1.56K
median monthly rent (2025)
32.8%
average share of income spent on rent (2025)
Comparing rent to renter income provides one measure of rental affordability. Dividing rent by income provides what is called a rent-to-income ratio. A higher ratio of rent-to-income indicates rent is less affordable while a lower ratio indicates it's more affordable.
Get weekly insights
Subscribe for data-driven insights. No spin, just the facts.
The Department of Housing and Urban Development considers households with a rent-to-income ratio of more than 30%, that is, households that spend more than 30% of their income on housing, to be cost-burdened. Cost-burdened households may have less money for other necessities such as food, healthcare, or savings. When median monthly rent is more than 30% of median monthly income, it means a typical household would meet the definition of housing cost-burdened.
Median rent was 32.8% of median renter household income in 2025.
Ratio of median rent to median renter household income
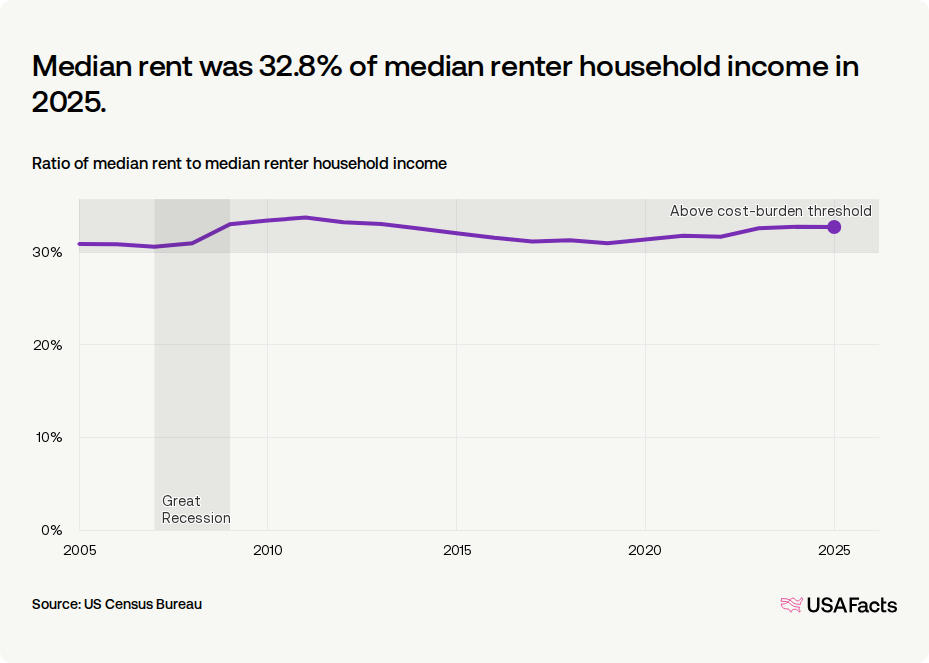
The national rent-to-income ratio reached a high of 33.8% in 2011 following the Great Recession. It was 32.8% in 2025 after decreasing 0.02 percentage points from the previous year.
Where is rent most and least affordable?
The ratio of average rent to average income varies throughout the United States. It was highest in Puerto Rico (38.8%) and Florida (37.1%) and lowest in North Dakota (22.7%) and Wyoming (23.2%).
Compared to income, rent was highest in Puerto Rico in 2025.
Ratio of median gross rent to median renter household income, 2025

In 2025, median rent in Puerto Rico was $593 per month, the lowest of all 50 states plus Washington, DC, and Puerto Rico. Median monthly renter household income was $1,529, resulting in the least affordable rental market and a 38.8% rent-to-income ratio.
Renter income and rent, by state (2025)
| 1. | Washington, DC | $6,645 |
| 2. | Hawaii | $6,347 |
| 3. | California | $6,240 |
| 4. | Washington state | $5,910 |
| 5. | Colorado | $5,743 |
| 6. | New Hampshire | $5,670 |
| 7. | New Jersey | $5,636 |
| 8. | Massachusetts | $5,598 |
| 9. | Maryland | $5,552 |
| 10. | Virginia | $5,453 |
Keep exploring

Methodology
USAFacts standardizes data, in areas such as time and demographics, to make it easier to understand and compare.
Page sources
USAFacts endeavors to share the most up-to-date information available. We sourced the data on this page directly from government agencies; however, the intervals at which agencies publish updated data vary.
