What is the current inflation rate in the US?
Refreshed monthly
The inflation rate was 3.5%, as of June 2026.
3.5%
headline inflation rate, all items (June 2025 to June 2026)
2.6%
core inflation rate, excluding food and energy (June 2025 to June 2026)
The CPI tracks two measures of inflation: headline and core. Headline inflation tracks specific subsets of consumer spending like food, housing, and transportation to reflect the actual cost of living. The “basket of goods” is meant to represent the actual spending habits of a typical consumer in the US. Core inflation tracks all other spending categories.
Food and energy prices in particular can be highly volatile due to factors like weather or supply chain issues, so excluding these categories from core inflation gives a clearer picture of long-term price trends.
In June 2026, the headline inflation rate was 3.5% and core inflation was 2.6%.
Headline inflation was higher than core inflation in June 2026.
Year-over-year percent change of CPI-U, all urban areas, not seasonally adjusted
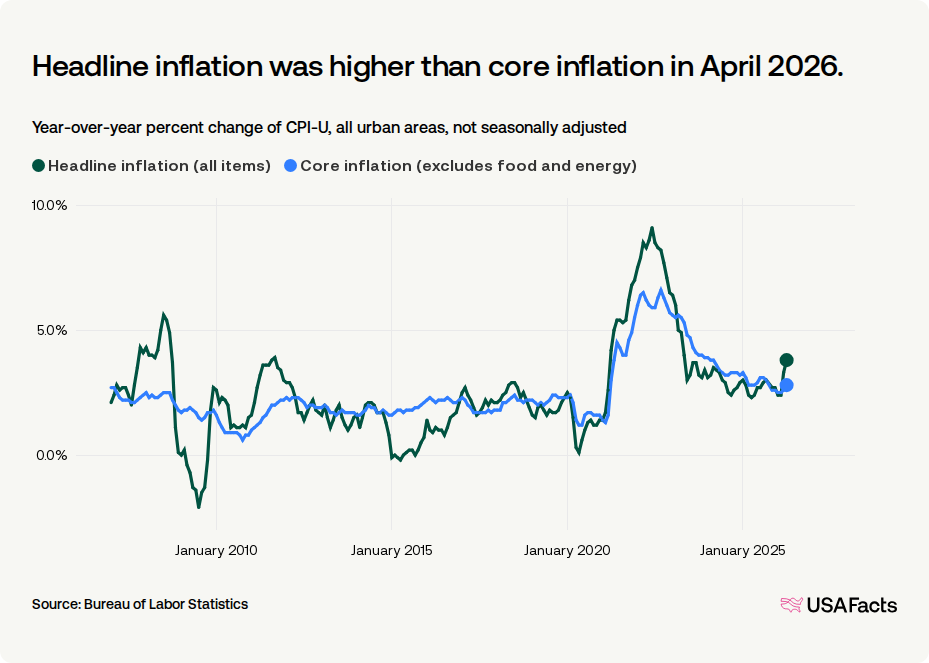
When inflation rates are positive, it means that the price of goods is increasing. When inflation decreases—for example, from 9.1% in June 2022 to 3.0% in June 2023—prices are still rising, just at a slower pace than before. If the inflation rate is above zero, prices are rising. Prices only fall during deflation, which occurs when the inflation rate drops below zero, signaling a general decline in the cost of goods and services.
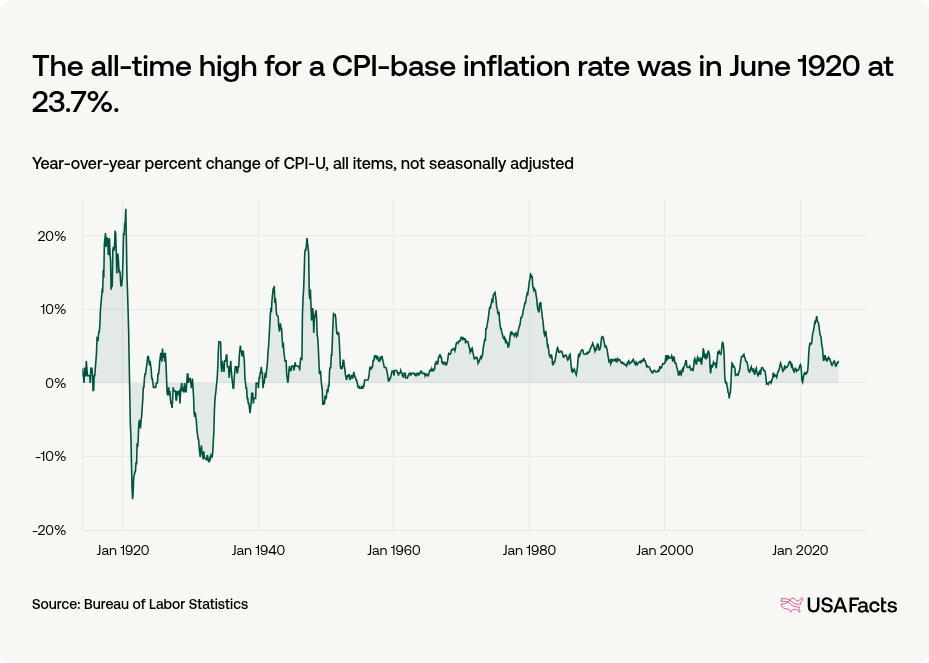
Since the CPI was first measured in 1913, inflation has fluctuated but has generally remained positive. The last time headline inflation exceeded 10% was in October 1981. The all-time high was in June 1920, when inflation reached 23.7%. The most recent month in which there was deflation was April 2015.
The all-time high for a CPI-base inflation rate was in June 1920 at 23.7%.
Year-over-year percent change of CPI-U, all items, not seasonally adjusted
Price changes within the basket of goods can vary widely. To account for this, the CPI uses a weighted system to represent how much the average consumer spends on a particular category it compared to everything else, so housing-related costs have more weight than something like recreation.
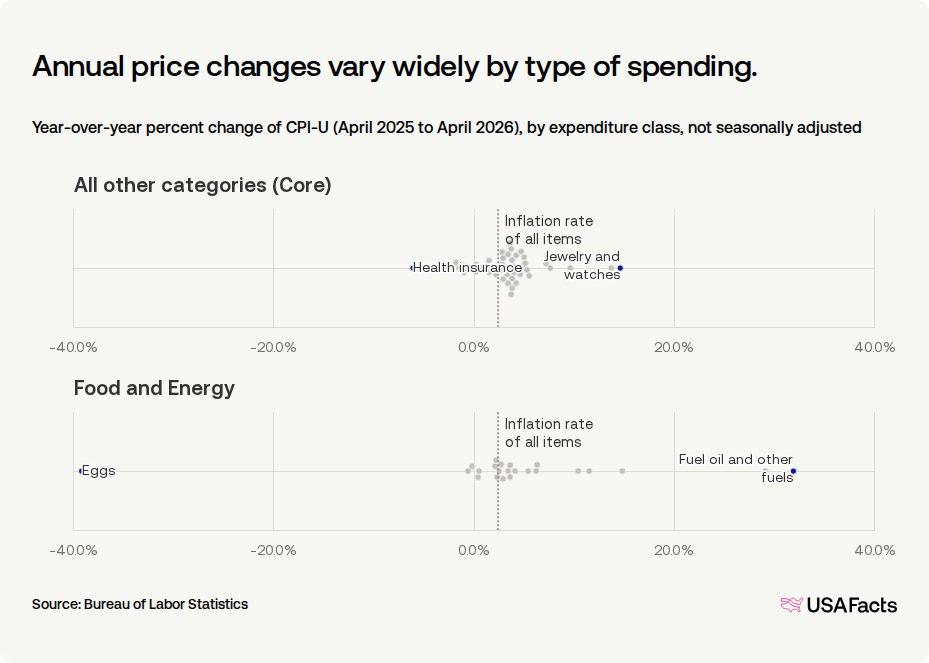
The weighted system means that even if the prices of some items spike the headline inflation rate reflects the overall change in costs across the entire basket of goods. While the current headline inflation rate is 3.5%, the cost of motor fuel has increased by 27.2% compared to the previous year. On the other hand, eggs prices have dropped by 27.9%.
When only looking at items considered in the core inflation rate, public transportation had the highest price increase at 16.9%. health insurance dropped the most (-7.4%).
Annual price changes vary widely by type of spending.
Year-over-year percent change of CPI-U (June 2025 to June 2026), by expenditure class, not seasonally adjusted
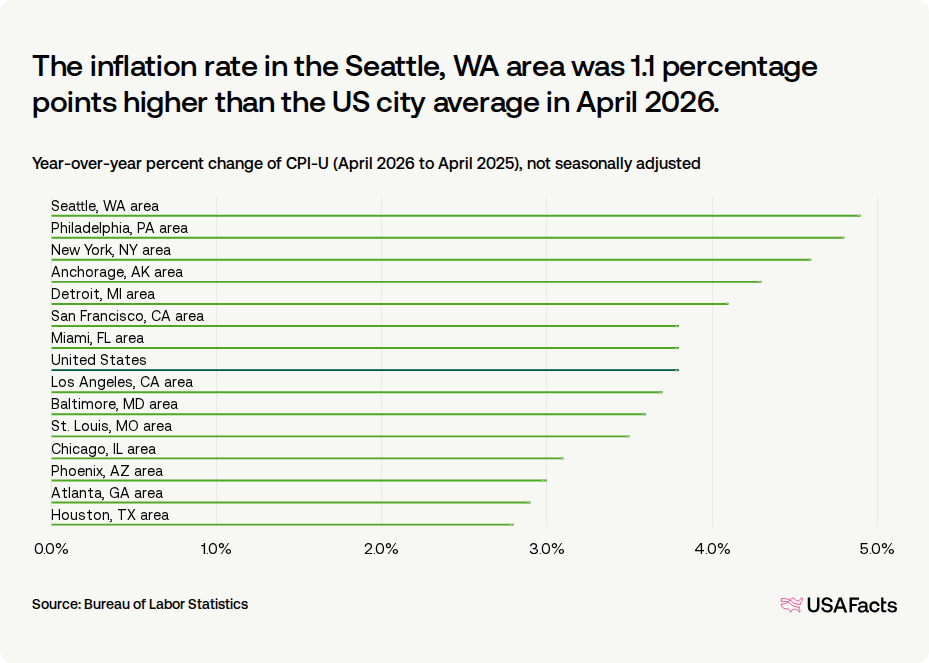
The CPI is representative of all urban areas in the US. Because every area has its own mix of supply and demand, inflation rates differ by location too. Based on data from June 2026 for urban areas tracked in the CPI, the Philadelphia-Camden-Wilmington, PA-NJ-DE-MD Metro Area had the highest inflation rate at 5.4%.
The inflation rate in the Philadelphia, PA area was 1.9 percentage points higher than the US city average in June 2026.
Year-over-year percent change of CPI-U (June 2026 to June 2025), not seasonally adjusted
Keep exploring
Methodology
USAFacts standardizes data, in areas such as time and demographics, to make it easier to understand and compare.
Page sources
USAFacts endeavors to share the most up-to-date information available. We sourced the data on this page directly from government agencies; however, the intervals at which agencies publish updated data vary.
