This chart tells you everything you want to know about government spending
Where is taxpayer money going? Here's a look at the big picture.
Each year, the federal government takes in trillions of dollars in revenue and spends those trillions (and often more) to address its domestic and global objectives. Dividing this budget by revenue sources and spending programs across the branches of government provides a wealth of insight into how the federal government works, where its spending priorities lie, and how it funds programs.
Government spending data is a part of USAFacts’ backbone, and we believe that American taxpayers — the shareholders responsible for providing most government resources — are entitled to information on how the federal government operates. That starts with the budget.
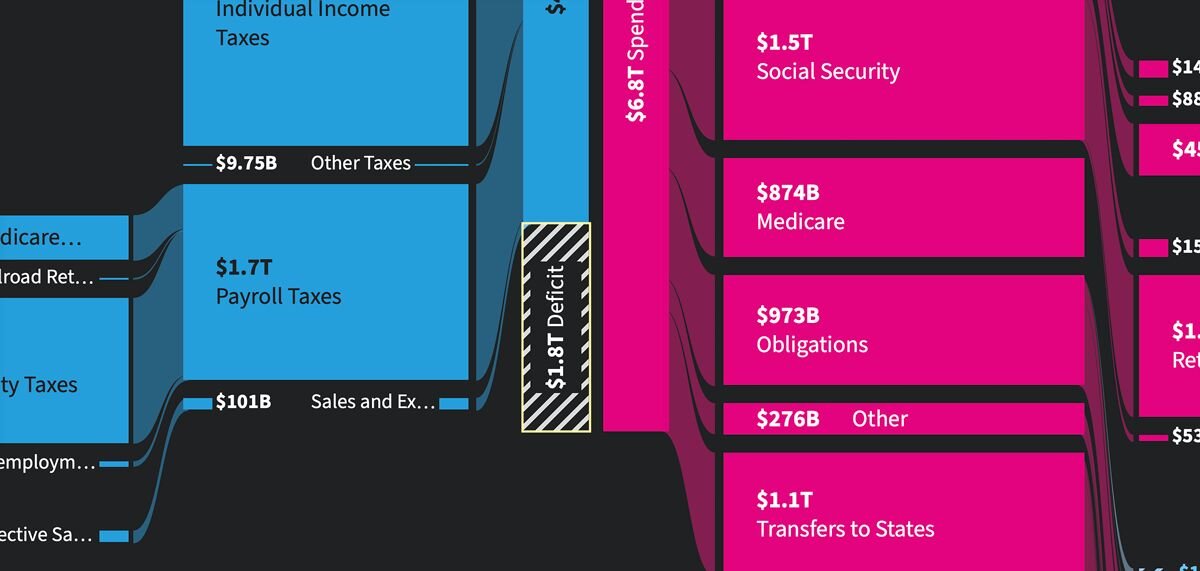
In this data visualization — called a Sankey chart — USAFacts breaks down the most recent federal budget data:
A Sankey chart illustrates a flow of data from one condition to another, making it a useful way to visualize how revenues flow in and expenses flow out of the nation’s budget.
In this case, the blue blocks on the left represent government revenue from sources like taxes and financial earnings, which flow left to right into the $4.9 trillion total federal revenue for fiscal year 2024. On the right, the magenta blocks represent $6.8 trillion in FY 2024 government spending, which flow into categories.
The striped segment in the center indicates the $1.8 trillion difference between revenue and spending in FY 2024, commonly called the deficit.

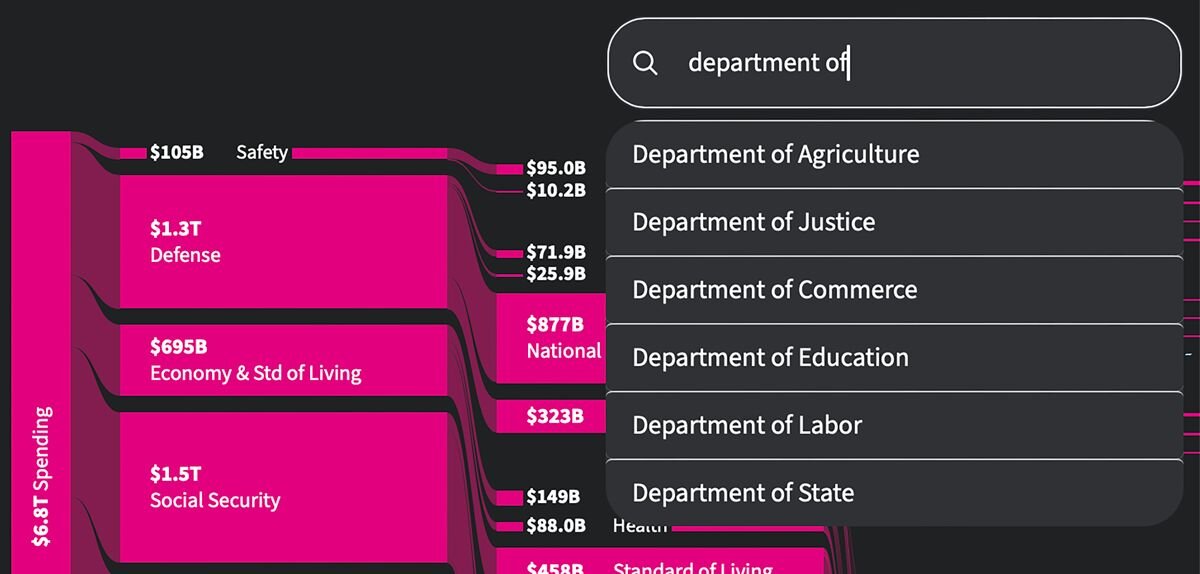
The left-most magenta column represents top-line spending categories like defense and Social Security. In the next column, those top-line categories are broken down into components. In the case of the $1.3 trillion defense budget:
- $877 billion was spent on national defense
- $323 billion was spent on support for veterans
- $71.9 billion was spent on foreign affairs
- $25.9 billion was spent on immigration and border security
When applicable, those categories are themselves broken down: in the case of veteran support, the final column reflects how that $323 billion was allocated towards veteran pension and disability benefits, medical care, readjustment benefits, housing, and other priorities.
Similarly, revenue sources are grouped into larger categories in the center-most blue column with breakdowns to the left.
Federal spending can also be organized by government divisions including departments, agencies, bureaus, and offices. To see spending data on a specific federal agency or program, type its name into the search bar in the top right of the visualization. This will display how, for instance, the Department of Labor spent $66.2 billion in FY 2024.

For much more on the federal budget, visit our government spending hub and sign up for our weekly newsletter.