A data-driven guide to
The trends in housing affordability and subsidized housing
Intro
Housing is a key issue impacting many communities across the United States. This guide presents data on subsidized housing availability, rental costs relative to incomes, and homeownership trends to provide a clearer picture of the current housing landscape.
Burden of housing costs
Housing costs differ based on a number of factors, including location and income. Explore how much American households spend on housing and how many households overspend based on their incomes.
- Homeownership rateIn the US, 2 in 3 households owned their home in 2025.Source: US Census Bureau
- Cost burdened householdsA higher share of renter households are cost-burdened than owner households.Source: US Census Bureau
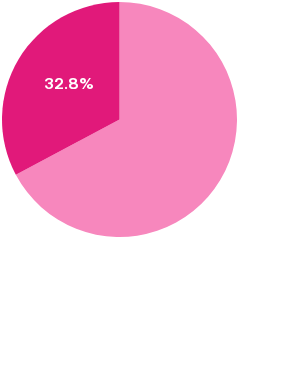
- Household rentIn 2024, median rent was 32.8% of median incomeSource: US Census Bureau
Subsidized housing
Subsidized housing is government-assisted housing where tenants pay reduced rent based on their income. Explore the issue by the numbers, including housing availability and waiting time.
- Subsidized housingIn 2023, there were 5.1M subsidized housing units in the US.Source: US Department of Housing and Urban Development

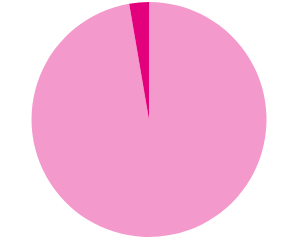
- Subsidized housing2.7% of the US population in 2023 lived in subsidized housing.Source: US Department of Housing and Urban Development & 1 more
- Subsidized housingThe average time spent waiting for subsidized housing in 2024 was two years and three months.Source: US Department of Housing and Urban Development