What is the labor force participation rate in the US?
Refreshed monthly
It was 62% in February 2026. The labor force participation rate measures the percent of people ages 16 and older engaged in the labor market, including those who are working or who are unemployed but actively looking for a job.
62%
labor force participation rate (February 2026)
-0.5
percentage point change from February 2025
The rate is a frequently referred to economic indicator. A rising labor force participation rate means a growing share of the working-age population is employed or looking for a job; a falling rate means a shrinking share of people working/looking. Fast labor force growth is tied to faster GDP growth, according to the Bureau of Labor Statistics. The inverse is true for slower labor force growth.
Various factors influence the labor force participation rate. For example, the rate often falls during recessions or economic shocks, such as the Great Recession or COVID-19 pandemic. It is also impacted by non-economic factors like the aging of the population or the choice of some to attend college rather than work.
In February 2026, the labor force participation rate was 5.3 points below its early 2000 peak.
Seasonally adjusted labor force participation rate, January 1948–February 2026

The labor force participation rate reached a peak of 67.3% in early 2000. Labor force participation followed an upward trend in the several decades leading up to that peak primarily due to more women entering the workforce.
Labor force participation among women rose 28.1 points between 1948 and 2000.
Seasonally adjusted labor force participation rate by sex, January 1948–February 2026

Men persistently have higher labor force participation rates than women. However, the gap has narrowed since data collection began in 1948. From then until the beginning of 2000, labor force participation fell by 11.6 points among men and grew by 28.1 points among women. In February 2026, 67.2% of men older than 16 were in the labor force while 57.2% of women were, a difference of 10.0 percentage points.
The overall labor force participation rate grew during the second half of the 1900s but trended downwards during the first two decades of the 2000s. The Bureau of Labor Statistics attributes the decline primarily to the aging population. Older adults are less likely to work than younger ones. As older Americans comprise an increasing share of the population, labor force participation declines accordingly.
The labor force participation rate among those 55 and older was 47 points lower than adults ages 25–54 in February.
Seasonally adjusted labor force participation rates by age group, February 2026

In February 2026, the labor force participation rate among people ages 55 and older was 37.3%. It was 83.9% among those ages 25–54, a group often referred to as prime-age workers.
The rate also varies nationwide. This may be the result of varied demographics and economies. In December, the most recent state-level data, the rate was as high as 69.9% in Nebraska and as low as 54.6% in West Virginia. It was 71% in Washington, DC, but the capital more closely resembles a city rather than a state.
West Virginia had December 2025's lowest labor force participation rate.
Seasonally adjusted labor force participation rates by state, December 2025

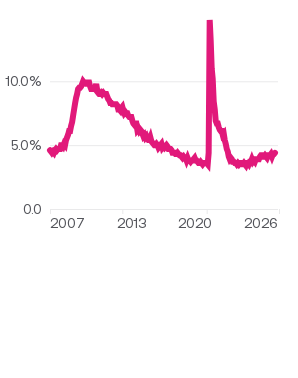
UNEMPLOYMENT RATE
In February 2026, the unemployment rate was 4.4%.
Source: Bureau of Labor Statistics
Keep exploring
Methodology
USAFacts standardizes data, in areas such as time and demographics, to make it easier to understand and compare.
The analysis was generated with the help of AI and reviewed by USAFacts for accuracy.
Page sources
USAFacts endeavors to share the most up-to-date information available. We sourced the data on this page directly from government agencies; however, the intervals at which agencies publish updated data vary.
