How has military enlistment changed?
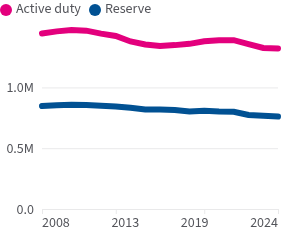
After decades of declining military applications and enrollments, the military expects to exceed 2025 recruiting goals.
Military enlistment fell for 40 years and hit a low in 2022. But that decline could be reversing: in October 2024 the Defense Department announced that an estimated 146,473 people enlisted in the US armed forces in FY 2024, up 14% from FY 2022.
As of April 2025, all branches of the military except for Space Force were on track to meet or exceed their recruitment goals: the Army was at 116%, the Marine Corps was at 104%, the Navy at 101%, the Air Force at 101%, and Space Force at 97%.
The Department of Defense (DOD) anticipates meeting all its 2025 recruitment goals. DOD also measures the quality of applicants through methods such as an aptitude test, educational credentials, physical fitness examination, among others. Recruits in three branches (Air Force, Marine Corps and Space Force) met or exceeded quality benchmarks.
What changes have been made to military recruitment efforts?
Congress and the military have made recent changes to boost recruitment, including offering higher compensation and adjusting recruitment strategies. Congress approved basic pay increases of 4.6% in 2023, 5.2% in 2024, and 4.5% in 2025, with an additional 10.5% increase for junior enlistees effective April 2025.
These were the largest annual increases to basic pay in 20 years. In dollars, pay for a new enlistee with less than two years of experience went from just shy of $22,000 in 2022 to $27,828 in 2025.
Along with pay increases, the military adjusted its messaging, deployed additional recruiters, and piloted training programs to better prepare applicants.
What challenges remain in military enlistment?
Despite the recent recruitment gains, the overall size of the military workforce is down 38% from 1980; the total number of active-duty service members has declined 45,861 from 2022 to 2024, for a total of just under 1.3 million. And some recruiting challenges remain: The DOD reports that 77% of young adults in the US are unqualified to serve without a waiver.
The three most-common factors for disqualification are obesity, educational deficits, and criminal or drug abuse records. Young adults also report low interest in serving. In a 2024 survey, 87% of people aged 16–21 said they were either “probably not” or “definitely not” considering enlistment.
Which military branches are growing? Which are shrinking?
Every military branch has fewer active-duty personnel than it did in the latter half of the 20th century. Total enlistment peaked in the late 1960s during the Vietnam War. The Army had its most members — more than 1.5 million — in 1968. In 2024, it had about 450,000; 29% of the 1968 high.
In the last ten years, the Navy has been the only branch to have overall growth, increasing active-duty personnel by about 2% from 2014 (326,054) to 2024 (332,336). The Army shrank more than 11% during that decade, the Marine Corps declined almost 8%, and the Air Force numbers remained nearly flat.
How has the size of the military’s entry-level workforce changed?
The total number of enlistees at entry-level pay grades (E-1, E-2, and E-3) declined 8.8% between 2014 and 2024, from 303,368 to 276,522.
The Navy had the largest percentage decline of all the forces over the past 10 years, with a 16.1% drop, while the Army had the biggest decline in sheer numbers at 15,195. The Air Force was the only branch to grow, with 7.7% more entry-level enlistees.
What does enlistment look like across the country?
DOD data shows that five states accounted for more than 40% of all new military recruits in FY 2022, with the most coming from Texas (12.2%).
This list includes four of the five most populous states (Georgia is 8th). To better account for population differences, the DOD also calculates a ratio indicating recruitment numbers relative to a state’s share of the US population of 18-to-24-year-olds.
By this calculation, enlistees from Hawaii, Florida, and Georgia are the most overrepresented in the military relative to their state populations. Those from Massachusetts, North Dakota, and Vermont are the most underrepresented.
What benefits can recruits receive?
The armed services offer enlistment bonuses to attract new recruits, plus ongoing benefits such as healthcare and stipends for housing and child care to support service members and their families. It also offers scholarships and tuition assistance for service members, veterans, and their families.
Service members who retire from the military with 20 or more years of service receive a pension based on the average of their 36 highest months of basic pay. Veterans can also receive assistance to transition into civilian life, career counseling, mental health counseling, and no- or low-cost VA health insurance.
Where did this data come from?
Data on the military branches’ 2023 and 2024 recruitment performance comes from September press releases from the Office of the Under Secretary for Personnel and Readiness. 2025 recruitment goals comes from a monthly Defense Department’s press release.
Application and enlistment data comes from the Population Representation in the Military Services: Fiscal Year 2022 Summary Report, which was released by the DOD Office of People Analytics in 2025. Data about which military branches are growing and shrinking comes from DOD Personnel, Workforce Reports & Publications; this analysis uses numbers from September of each fiscal year.
The schedule of military pay increases comes from the Congressional Research Service and pay by enlistment level comes from the Defense Finance and Accounting Service.
Learn more about the demographics of the US military, where US troops are stationed, and get the data directly in your inbox by signing up for our email newsletter

