Is crime going up or down?
Violent and property crime rates were lower in 2025 than in 2024 and have generally declined nationwide since the early 1990s.
In 2025, both violent and property crime rates were lower than in 2024. The violent crime rate decreased 9.7%, from 362.9 to 327.6 crimes per 100,000 people, while the property crime rate decreased 12.8%, from 1,761.1 to 1,534.8.
This continues a longer trend of declining crime rates. Between 2005 and 2025, the violent crime rate fell 32.8%, from 487.6 to 327.6 crimes per 100,000 people, while the property crime rate decreased 56.0%, from 3,486.3 to 1,534.8.
Compared with 2024, violent and property crime rates decreased by 9.7% and 12.8%, respectively.
Reported violent and property crimes per 100,000 people, 1976–2025
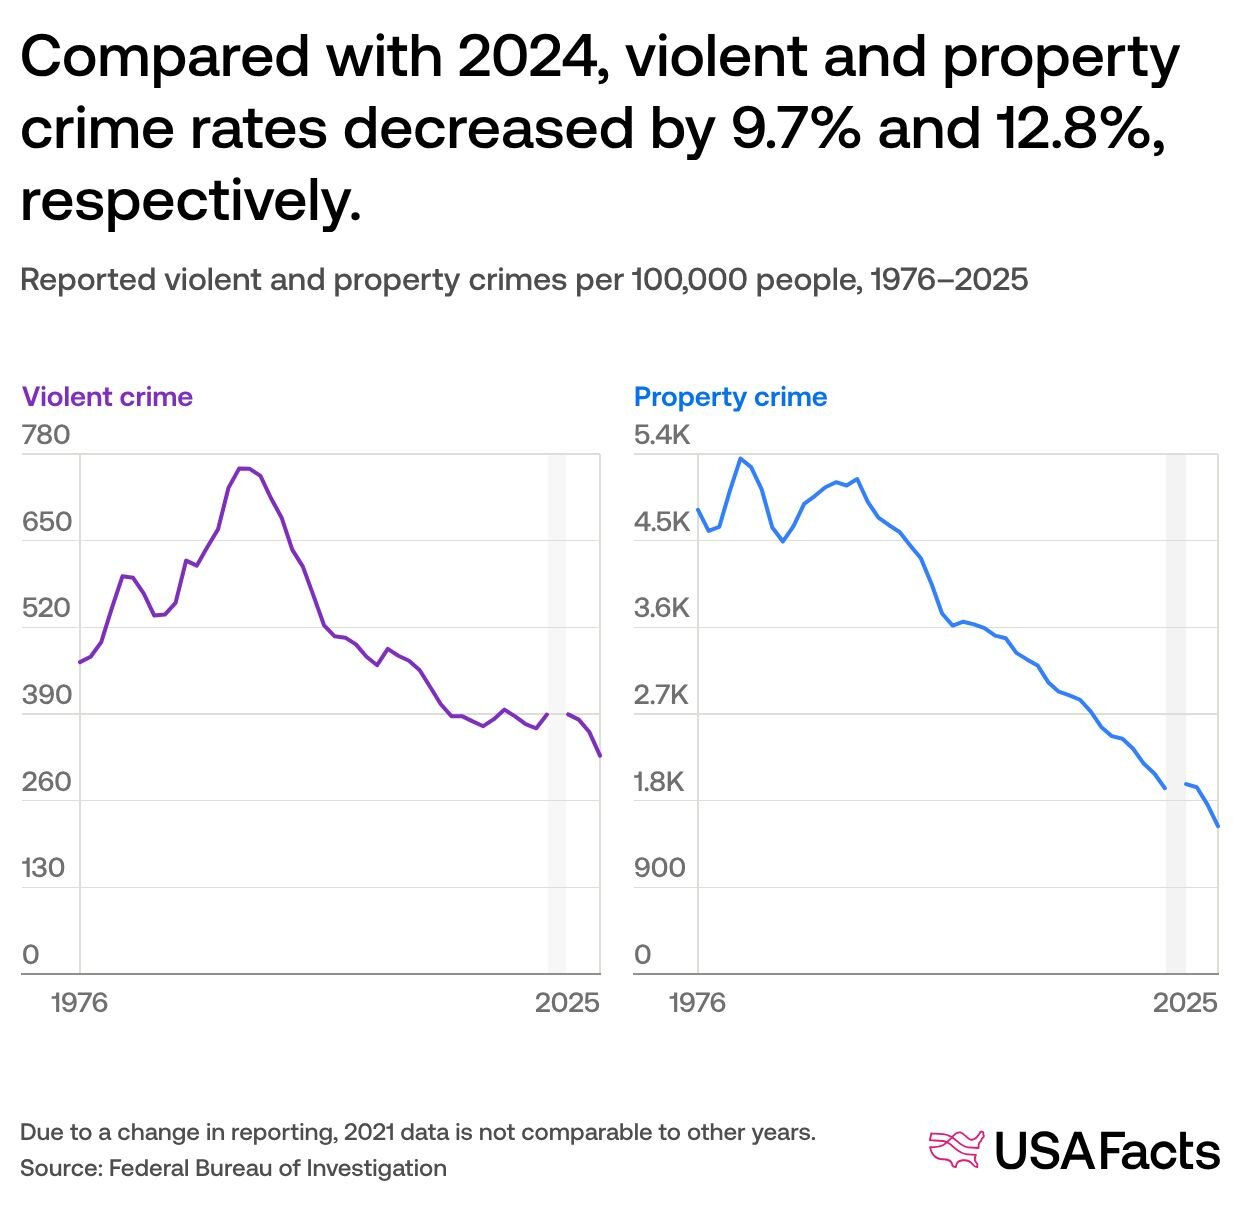
In fact, crime rates have generally trended downward since the early 1990s. Since 1991, the national violent crime rate has decreased in all but six years, while the property crime rate has declined in all but two years.
How does the FBI define violent and property crime?
How does the FBI define violent and property crime?
The Federal Bureau of Investigation's (FBI) Uniform Crime Reporting (UCR) program classifies violent crimes as those involving force or the threat of force. They are categorized into four specific offenses: murder and nonnegligent manslaughter, rape, robbery, and aggravated assault.
The UCR defines property crime as a crime during which someone takes money or property without using force or threats. Property crimes include burglary, larceny-theft, and motor vehicle theft.
Arson is also considered a property crime, and total offenses are reported, but the numbers are too small to calculate reliable rates—so the FBI does not publish arson rates.
Get weekly insights
Subscribe for data-driven insights. No spin, just the facts.
How have violent crime rates changed by state?
Violent crime rates decreased in 40 states and Washington, DC, between 2005 and 2025. They declined by more than half in Florida (63.1%), Connecticut (60.1%), and Illinois (54.5%).
Violent crime rates rose in ten states since 2005, led by North Dakota (142.5%), Vermont (79.1%), and South Dakota (75.0%).
The violent crime rate has fallen by more than half in Florida while more than doubling in North Dakota.
Percent change in reported violent crimes per 100,000 people, by state, 2005 to 2025

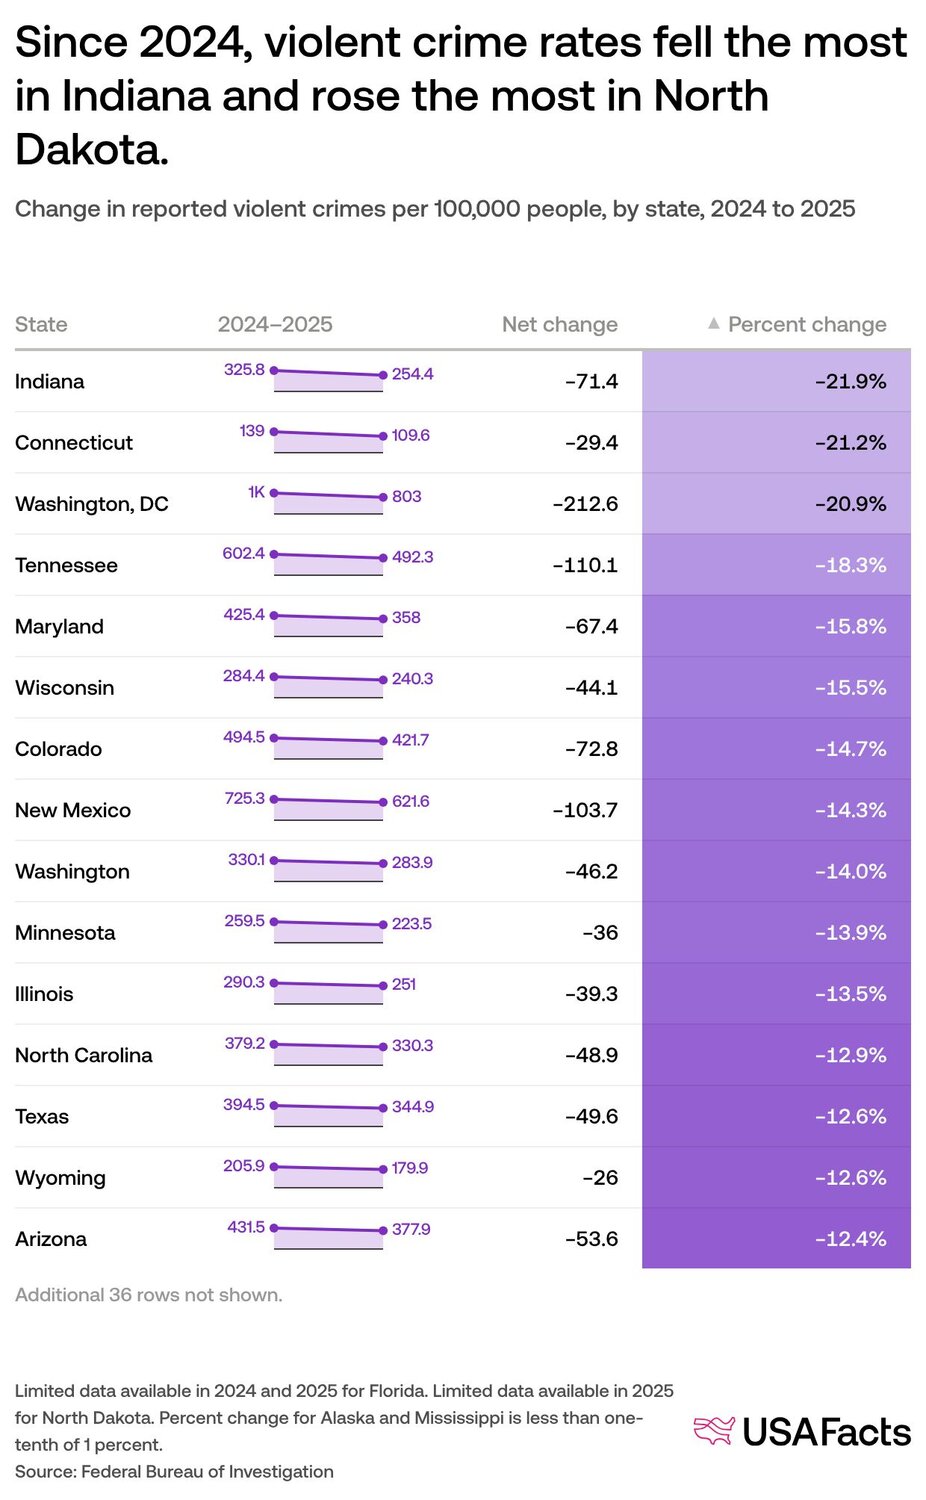
Between 2024 and 2025, violent crime decreased in 46 states and Washington, DC. Three jurisdictions saw decreases of at least 20%: Indiana (21.9%), Connecticut (21.2%, and Washington, DC (20.9%).
Nationally, the violent crime rate fell 9.7% between 2024 and 2025 with the largest decline in the robbery rate, which fell from 61.0 per 100,000 people to 49.4, a 18.9% drop.
Aggravated assault, defined by the FBI as “unlawful attack by one person upon another for the purpose of inflicting severe or aggravated bodily injury,” comprised 72.6% of total violent crime in 2025, followed by robbery (15.1%), rape (11.0%), and murder and nonnegligent manslaughter (1.3%).
Since 2024, violent crime rates fell the most in Indiana and rose the most in North Dakota.
Change in reported violent crimes per 100,000 people, by state, 2024 to 2025
Where have property crime rates changed?
The property crime rate in every state and Washington, DC, was lower in 2025 than in 2005. Property crime rates declined by at least half in 36 states, with Idaho (77.6%) seeing the largest decrease. New York’s rate had the smallest decrease, at 25.3%.
Since 2024, violent crime rates fell the most in Indiana and rose the most in North Dakota.
Percent change in reported property crimes per 100,000 people, by state, 2005 to 2025

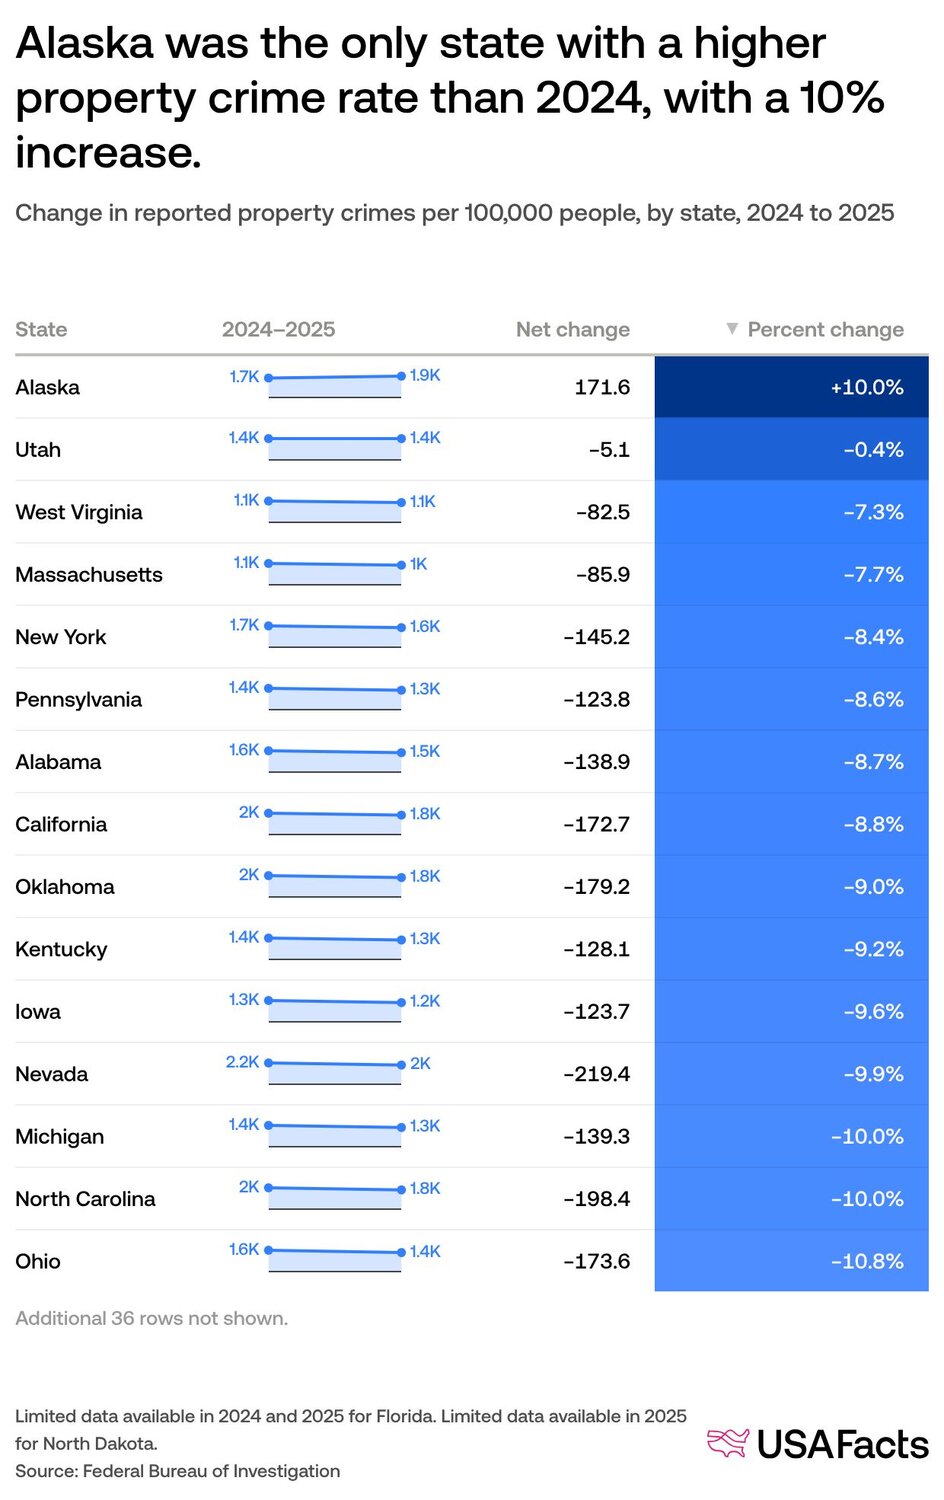
From 2024 to 2025, the property crime rate declined in 49 states and Washington, DC.
Indiana fell the most — 24.5% — followed by Washington state (20.8%), Hawaii (20.7%), Tennessee (20.1%), and Colorado (20.1%). Alaska was the only state with an increase, at 10.0%.
Nationally, the property crime rate decreased by 12.8% between 2024 and 2025, with the largest decline being a 23.0% drop in motor vehicle thefts.
Larceny — the theft of personal property — made up 74.5% of property crimes in 2025, followed by motor vehicle theft (12.8%), and burglary (12.6%).
Alaska was the only state with a higher property crime rate than 2024, with a 10% increase.
Change in reported property crimes per 100,000 people, by state, 2024 to 2025
Where does this data come from?
Where does this data come from?
The FBI is the main government source of US crime data. Since 1930, it’s collected crime data from local law enforcement agencies through the Summary Reporting System (SRS). The FBI has used this data to estimate national, regional, and state crime statistics since the 1960s.
The FBI phased out the SRS in 2021 in favor of the more comprehensive National Incident-Based Reporting System (NIBRS), which collects data on single incidents instead of aggregated summaries of crimes, allowing the data to capture more specific crime information.
The latest data available from the SRS is from 2020, while the NIBRS has data through 2025.
Law enforcement agencies are still transitioning to the new system. As of 2025, over 17,000 agencies representing nearly 97% of the US population had submitted data.
The FBI has always used partial population data to estimate crime outcomes, even in areas that don’t report. The more agencies that report data to the FBI, the more accurate the estimates become. This article uses data from both the NIBRS and the SRS to shed light on both recent geographic trends and trends over time.
Note that the FBI calculated the estimates used, applying recent NIBRS data to replicate the estimation methodology previously used for SRS data. This helps make the estimates comparable over time despite the change in reporting systems, although relatively lower reporting rates during the transition to NIBRS may still impact accuracy, so the data provided throughout this piece can still be used to approximate crime rate trends over time.
Dig in to more crime data, including which states have the highest murder rates, and get fresh data delivered to your inbox weekly by signing up for our newsletter.

Keep exploring
- How have property crime rates changed over time? - The national property crime rate decreased in 2024 to its lowest level in at least 48 years — the largest single year drop in that time.
- Which cities have the highest and lowest crime rates? - In 2024, violent and property crime rates were at their lowest levels in at least 48 years, having fallen by more than half since 1991.
- Which states have the highest and lowest crime rates? - In 2025, Alaska and New Mexico had the nation’s highest violent and property crime rates, respectively, despite declines from the previous year.
- What is the crime rate in the US?
