Native Americans and the US Census: How the count has changed
The federal government has counted the Native American population in various ways throughout the years. Recent data shows how the demographic is growing.
Between 2000 and 2018, the number of American residents who were at least partially Native American increased 39%, according to the US Census Bureau.
The estimated 5.7 million Americans in 2018 – 1.6 million more than 2000 – identifying with “American Indian or Alaska Native” racial backgrounds represent less than 2% of the total national population. That share was double the Native American group’s share in 2000.
It’s unclear if that increase is entirely due to population growth or because more people are identifying as Native American racially. The Census Bureau has historically counted the Native American population in varying ways. The agency is making counting Native Americans a priority for the 2020 Census, after an estimated 4.88% of Native Americans living on reservations went undercounted. (Nationally, there was a total overcount of 0.01%.)
In addition to the official decennial census conducted at the beginning of each decade, the Census Bureau also conducts the American Community Survey each year to learn more about the American population. Here’s a look at the Census’s history with Native Americans and what the agency’s most recent surveys say about that demographic group today.
Who makes up the Native American population?
In 2018, there were an estimated 2.8 million people identifying racially as Native American alone and 2.9 million more identifying as multiple races, including Native American.
American Indian and Alaska Native population
Between 2000 and 2018, the number of multiracial people identifying partially as Native American increased by 77%. The number of those who report being racially only Native American went up by 13%. When categorizing single-race Native Americans based on their Hispanic ethnicity, the Hispanic Native American population increased 53% while the non-Hispanic increased 5%.
Single-race Native American population by Hispanic ethnicity
What does the latest census data tell us about the Native American population?
The latest Census data — estimates from the 2018 American Community Survey — shows how American Indians and Alaska Natives differ from the wider population. On average, Native Americans are younger than the overall population. They also lag on key economic metrics.
Where do Native Americans live?
In 2018, three states accounted for 31% of people reporting to be only American Indian or Alaska Native and 34% of people claiming at least partially one of those two: California, Arizona, and Oklahoma. As a segment of the population, Alaska has the most substantial proportion of American Indians or Alaska Natives (20% in combination with another race, 15% alone.)
The Census Bureau also tracks population across 695 “American Indian areas, Native Alaska areas, and Hawaiian homelands.” Based on population estimates between 2013 to 2017, 36% of people reporting single-race Native American status lived in these areas. (Given the small populations of some of these areas, the estimates for these aren’t as recent as the 2018 figures cited in the rest of this piece.) The largest native population in these areas is the estimated 167,000 people living in Navajo Nation, primarily in Arizona, but in parts of New Mexico and Utah as well. (Navajo Nation is also home to 169,000 people who claim Native American racial identity at least partially.)
Just one metropolitan area, Phoenix, is home to more than 100,000 people claiming Native American racial identity alone. But when adding multiracial Native American people, five metro areas have a Native American population exceeding 100,000:
- Los Angeles, California (233,745)
- New York, New York (178,677)
- Phoenix, Arizona (161,178)
- Tulsa, Oklahoma (138,573)
- Oklahoma City, Oklahoma (104,789)
Native Americans and the Census
Historically, Native Americans weren’t counted as a group until 1860. For the next few census counts, census takers were told not to count “Indians not taxed,” a phrase mentioned in the Constitution and interpreted as those living on reservations or outside of recognized settlements. The 1890 Census was the first one to count Native Americans throughout the country. The 1930 census featured an additional form for what it called the “Indian population.”
The 1970 Census asked those who said their race was American Indian also to include a tribal affiliation. In 1980, the questionnaire started counting Eskimos and Aleuts separately. But the 2000 survey, combined “American Indian” and “Alaska Native” into a single identity. It was also the year the Census introduced the concept of identifying as more than one race. It’s hard to compare the Census count for the American Indian and Alaska Native population today to counts before 2000.
How does the Census record tribal affiliations?
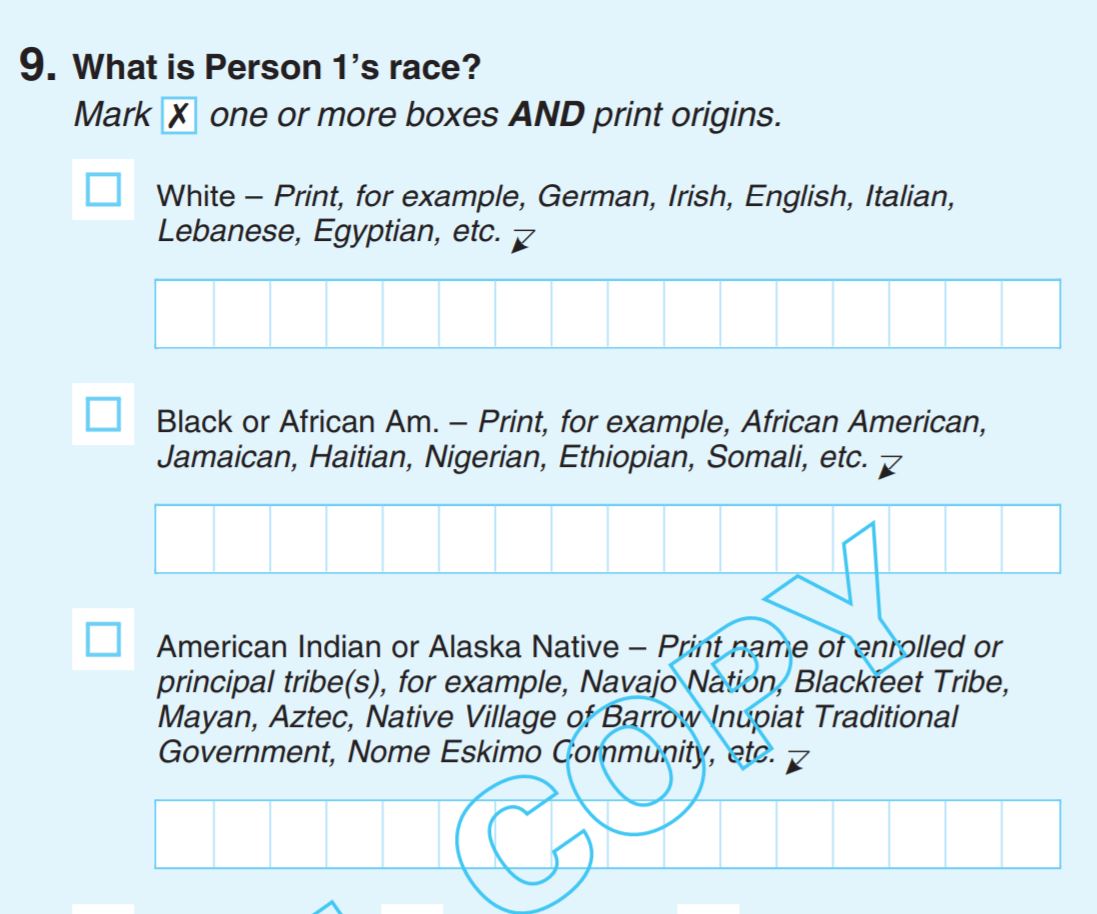
The Census Bureau’s questions ask respondents who self-identify as American Indian or Alaska Native for their specific tribal identity.
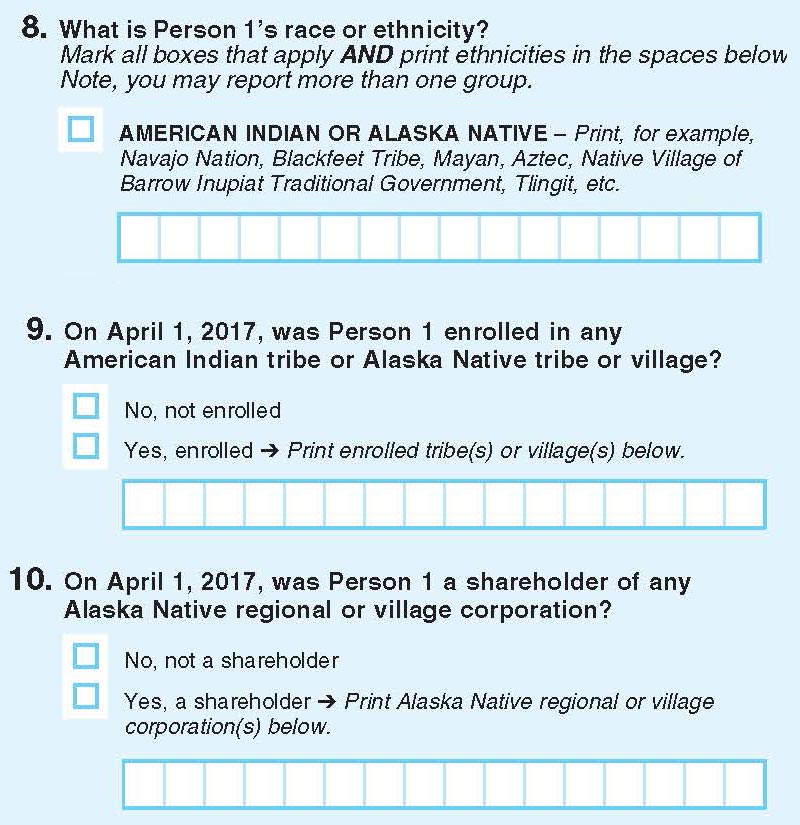
In 2017, the agency tested two potential questions for the 2020 census that would go beyond tribal identity, asking if the person was officially a member of a tribe. The two questions asked if the person is:
- “enrolled in any American Indian tribe or Alaska Native tribe or village?”
- “a shareholder of any Alaska Native regional or village corporation?”
The agency opted not to include those questions in 2020 after a series of meetings with tribal groups. Individual tribal enrollment data is the responsibility of the sovereign tribal nations, and self-identification data would likely not match tribal data, according to the Census Bureau’s explanation of the decision.
The 2020 Census will continue to ask about tribal affiliations as a subset of its question about race.
An increase in people identifying racially as Native American means more people are identifying with individual tribes.
Cherokee, the largest tribal grouping, grew 48%: from 730,000 in 2000 to 1.1 million in 2018, according to the Census.
The 2020 Census
The 2020 Census will take place after agency officials held meetings with hundreds of tribal representatives about how best to count the Native American population. The results of the 2020 count won’t be available for months. Still, Census counts in recent decades show a growing Native American population, especially when including people identifying as Native American along with other racial identities.
Keep exploring
Page sources
Census Bureau
Census Bureau Releases Estimates of Undercount and Overcount in the 2010 Census
