What does the Department of Veterans Affairs (VA) do?
The Department of Veterans Affairs (VA) is a cabinet-level executive branch agency responsible for providing healthcare services, benefits programs, and access to national cemeteries for the nation's veterans and their dependents. It was established as the Veterans Administration in 1930 and elevated to cabinet status in 1989.
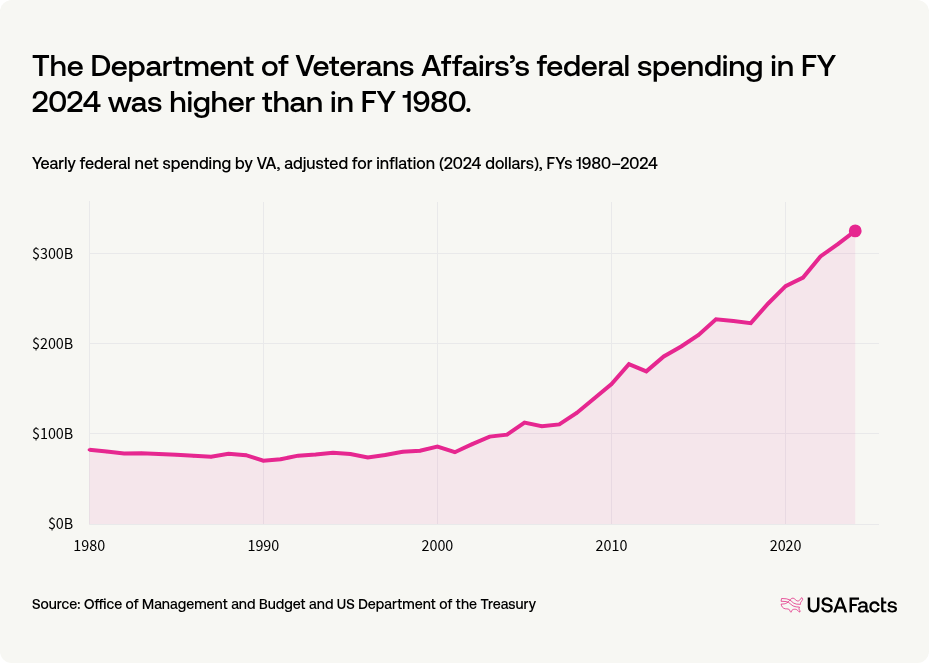
$325B
4.8%
How much does the Department of Veterans Affairs spend?
The Department of Veterans Affairs accounted for 4.8% of all federal spending in FY 2024.
Share of VA net spending compared to the top ten highest spending agencies in FY 2024

Get weekly insights
Subscribe for data-driven insights. No spin, just the facts.
The Department of Veterans Affairs’s federal spending in FY 2024 was higher than in FY 1980.
Yearly federal net spending by VA, adjusted for inflation (2024 dollars), FYs 1980–2024
The Department of Veterans Affairs's share of federal spending in FY 2024 was higher than in FY 1980.
Percentage of federal budget dedicated to VA, FYs 1980–2024

How did the Department of Veterans Affairs spend its budget in 2024?
Federal government net spending isolated to VA, FY 2024

Read related content about the Department of Veterans Affairs:
- Supporting veterans: Over 93% of the Department of Veterans Affairs’ annual spending funds pensions, compensation, medical care, and education programs for veterans.
- Disabled veteran compensation: The average annual veteran disability compensation payment ranges from $1,425 to $48,227 per person.
How many people work for the Department of Veterans Affairs?
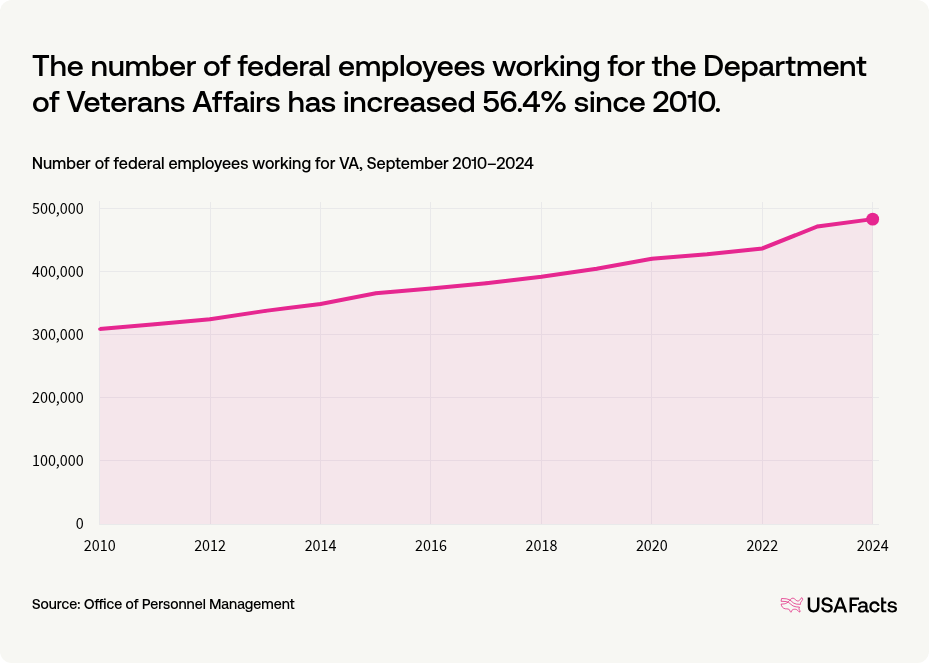
The number of federal employees working for the Department of Veterans Affairs has increased 56.4% since 2010.
Number of federal employees working for VA, September 2010–2024
Who leads the Department of Veterans Affairs?
The VA is led by the secretary of Veterans Affairs, who is nominated by the president, confirmed by the Senate, and then sworn into office. They are one of the 15 cabinet members who serve at the president's discretion. This appointed position typically ends when the appointee resigns, is replaced, or when a new president takes office and appoints their own cabinet. Some cabinet members serve temporarily during transitions between administrations.
Keep exploring
Methodology
USAFacts standardizes data, in areas such as time and demographics, to make it easier to understand and compare.
Page sources
USAFacts endeavors to share the most up-to-date information available. We sourced the data on this page directly from government agencies; however, the intervals at which agencies publish updated data vary.

