How many vacant homes are there in the US?
Over 15 million American homes — approximately 10% of the country’s housing inventory — were vacant in 2024.
There are many ways to assess the trajectory of the American housing market. Two key indicators are the total number of vacant homes and the vacancy rate. According to the Census Bureau, there were approximately 15.1 million vacant homes nationwide in 2024.
These unused homes, which include rentals, represent 10.3% of the country’s housing inventory. The number of vacant homes peaked at nearly 19 million in the wake of the 2008 housing crisis, but homeownership has since recovered and the number of vacant homes dropped more than 20% between 2009 and 2024.
Home vacancies have dropped 20% from their peak after the housing crisis.
Vacant housing units, 2000–2024
Homeownership rates vs vacancy rates
The homeownership rate is the percentage of homes that are owner-occupied. In the third quarter of 2025, the US homeownership rate was 65.2%. Over the last several decades, the homeownership rate peaked at 69.4% in the 2nd quarter of 2004 and reached a low of 63.1% in the second quarter of 2016.
The vacancy rate is the share of homes that are not lived in as a permanent residence. Vacation homes, even if occupied, are considered vacant because occupants have a permanent residence elsewhere. Uninhabitable housing, such as a house without a roof or windows, is excluded. Additionally, owned and rented units are tracked separately; rentals are more likely to be vacant.
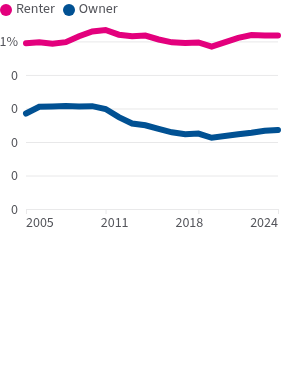
Vacancies generally declined for both from 2008 through 2021. Rental vacancies had a recent low in the fourth quarter of 2021 and have since increased 1.5 percentage points. Owner vacancies had a recent low in the second quarter of 2023 and have also increased, but 0.5 points.
As of the third quarter of 2025, 7.1% of rentals and 1.2% of homeowner inventory were on the market.
In Q3 2025, rental units were nearly six times likelier to be vacant than homes on the market.
Quarterly homeowner and rental vacancy rates, Q1 2000–Q3 2025
Overall, the gross national vacancy rate in 2024 was 10.3% — the lowest rate recorded in at least 25 years.
The national gross vacancy rate reached a 25-year low in 2024.
Gross vacancy rates, 2000–2024
Which states have the most vacant homes?
In 2024, Maine, Vermont, and Alaska had the nation’s highest gross vacancy rates. Maine has recorded the highest or tied for the highest rate in the nation for 13 of the past 14 years.
One in five homes in Maine was vacant in 2024 — the highest rate nationwide.
Gross vacancy rates by state, 2024
Home vacancy rates by state over time
The gross vacancy rate has been declining nationally. Since 2009, the first year of data after the 2008 housing crisis, gross vacancy rates were lower in every state in 2024. In sixteen states, the rate declined by at least 5 percentage points.
Florida had the biggest change — an 8.8 percentage point drop. It was followed by Arizona (-7.8) and Alaska (-7.4). Six states had gross vacancy rates over 20% in 2009, but Maine was the only state with a rate that high by 2024 (although its 2024 rate still represented an 2.1% drop).
The smallest changes were in Louisiana, whose rate declined by 0.1 percentage points, New York (-0.9), and Iowa (-1.0).
Every state had a lower vacancy rate in 2024 than in 2009.
Gross vacancy rate by state
But housing availability still depends greatly on the old adage: location, location, location.
Which metros have the most vacant homes?
Across the country, vacancy rates ranged from Cape Coral-Fort Myers, Florida’s high of 34.1% to a low of 4.0% in New Haven-Milford, Connecticut. The national average for America’s 75 largest metropolitan statistical areas was 9.1%.
Of the nation’s 75 largest metro areas, two in Florida — Cape Coral-Fort Myers and North Port-Bradenton-Sarasota — had gross vacancy rates that were 3.7x and 2.6x higher, respectively, than the national metropolitan average.
One out of three housing units in Cape Coral-Ft. Myers, FL, was vacant in 2024.
Gross vacancy rates for the 75 largest metropolitan statistical areas, 2024
This isn’t necessarily surprising: the gross vacancy rate is a measure of all vacant properties, including vacation properties, so states with several popular tourist destinations, like Florida, will always register slightly higher rates. The Census Bureau notes that the largest category of vacant housing is classified as “seasonal, recreational, or occasional use.” In over one-fifth of US counties, these units made up at least 50% of the vacant housing stock as of the 2020 Census.
Vacancy rates by metropolitan area over time
Between 2009 and 2024, Orlando-Kissimmee-Sanford, Florida recorded the highest gross vacancy rate decrease (-11.4 percentage points), while Buffalo-Cheektowaga-Niagara Falls, New York, recorded the largest rate increase (+4.9).
Vacancies fell in all but four of the most populated metro areas since 2009.
Gross vacancy rates of the 70 largest metropolitan areas, 2009–2024
What do these vacancy rates tell us about the housing market in general?
Taken on their own, lowering vacancy rates depict a tightening real estate market at both the metropolitan and state levels. Due to the economics of supply and demand, tightening supply elevates prices and affordability. It can also be a useful tool in discussions of consumer choice in housing and help inform potential sellers of when it might be most advantageous to put homes on the market. In the third quarter of 2025, more than half of the US residences classified as “year-round vacant” were actively held off the market. The data can also offer additional context into national housing trends, such as regional increases in homeownership.
Want more housing data, like homeownership, affordability, and subsidized housing? Subscribe to our flagship newsletter for weekly updates delivered to your inbox!

