How many people are in prisons in the US?
Refreshed annually
About 1.25 million at the end of 2023, the most recent year for which data is available. This number is up 2% from 2022 and includes anyone under state or federal jurisdiction. Prisoners sentenced to one or more years — usually for a felony conviction — make up 96.5% of this group, and the remainder includes people who are serving shorter sentences or awaiting sentencing.
1.25M
total prisoners in the US (Dec. 31, 2023)
+2.0%
change in the US prison population from 2022 to 2023
In 2023, the US prison population was 22.4% lower than the 2009 peak. Since annual data collection began in 2000, the biggest annual changes not related to COVID-19 were a 2.8% increase in 2006 and a 2.3% decrease in 2019.
The prison population in the US has decreased by 22.4% since its peak in 2009.
Prison population on Dec. 31, 2000–2023
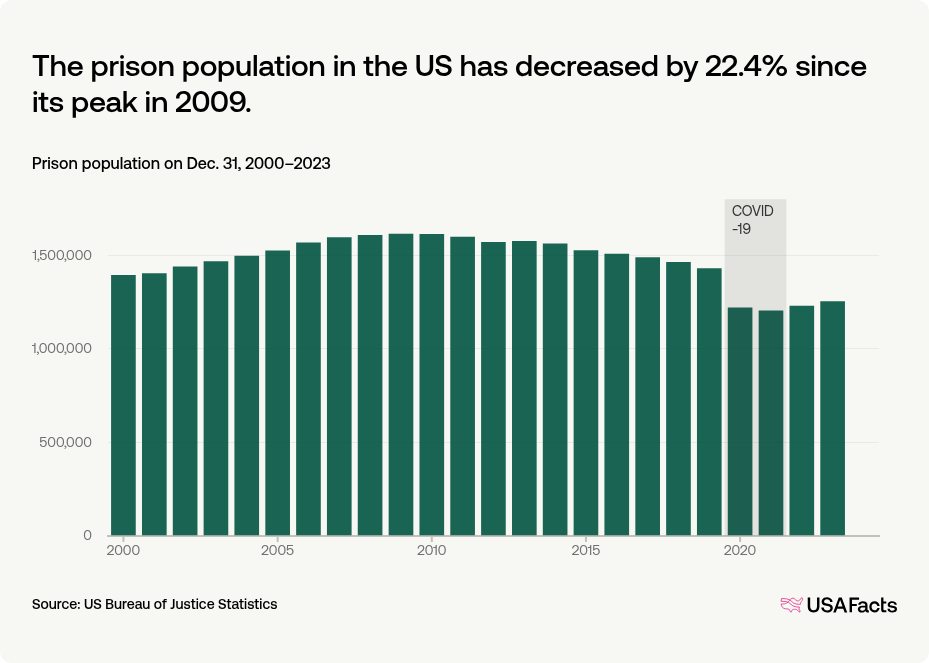
Between 2019 and 2020, the prison population declined sharply, falling 14.6%. The Bureau of Justice Statistics (BJS) attributed some of this to COVID-19, pointing to the deaths of nearly 2,500 state and federal prisoners between March 2020 and February 2021 as well as the 37,700 prisoners across 24 states who were released early from custody.
Which states have the highest incarceration rates?
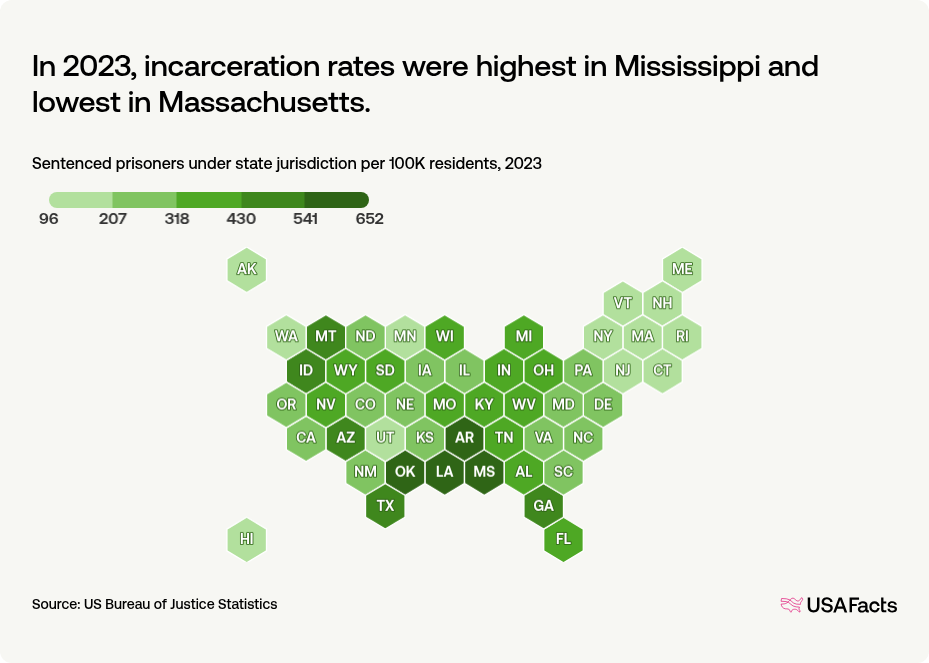
Across the US, 87.5% of prisoners were held under state jurisdiction and 12.5% under federal. Nationwide, 360 people per 100,000 residents were in prison.
In 2023, incarceration rates were highest in Mississippi and lowest in Massachusetts.
Sentenced prisoners under state jurisdiction per 100K residents, 2023
Are incarceration rates increasing or decreasing?
In 2023, there were 43 federal prisoners for every 100,000 US residents. Compared to a decade ago, incarceration rates decreased in 45 states and increased in 5 states, while the incarceration rate for federal prisoners decreased by 28.3%.
Over the last decade, incarceration rates decreased 49% in Massachusetts, the most of any state.
Sentenced prisoners under state jurisdiction per 100K residents, 2014 vs. 2023

Are more prisoners held in government-run facilities or private prisons?
Federal and state-run facilities housed 87.7% of prisoners. The remainder were held in the custody of private prisons or local jails. The federal system was relatively less reliant on local jails than states, and more reliant on private prisons. However, BJS notes that as of December 31, 2022, all federal prisoners in the custody of private prisons were in halfway houses and home confinement programs rather than secure facilities, which the Federal Bureau of Prisons stopped contracting with in November 2022.
91.1% of prisoners under federal jurisdiction were held in federal facilities.
As of Dec. 31, 2023

Are prisons overcrowded?
Among all states reporting data, Montana relied the most on private prisons, which housed 48.7% of its prisoners. Louisiana held 52.7% of its prisoners in local jails, the largest share of any state. Forty-seven states housed the majority of prisoners in state-run facilities, and these held more than 99% of the prison population in 15 states.
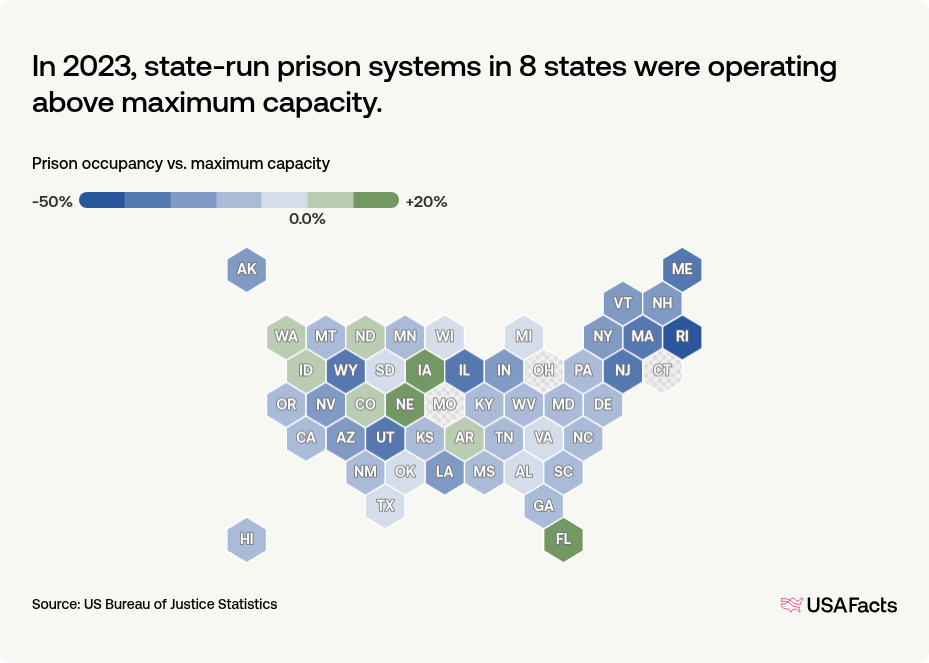
Every state, plus the Federal Bureau of Prisons, operates their own prisons. These facilities are built to house a specific number of people but sometimes, the number of prisoners can equal or exceed maximum capacity. In 2023, 8 states and the federal prison system fit this description. Connecticut, Missouri, and Ohio did not report capacity metrics.
In 2023, state-run prison systems in 8 states were operating above maximum capacity.
Prison occupancy vs. maximum capacity
Keep exploring
Methodology
USAFacts standardizes data, in areas such as time and demographics, to make it easier to understand and compare.
Page sources
USAFacts endeavors to share the most up-to-date information available. We sourced the data on this page directly from government agencies; however, the intervals at which agencies publish updated data vary.
