What is the gross domestic product (GDP) in the US?
Refreshed quarterly
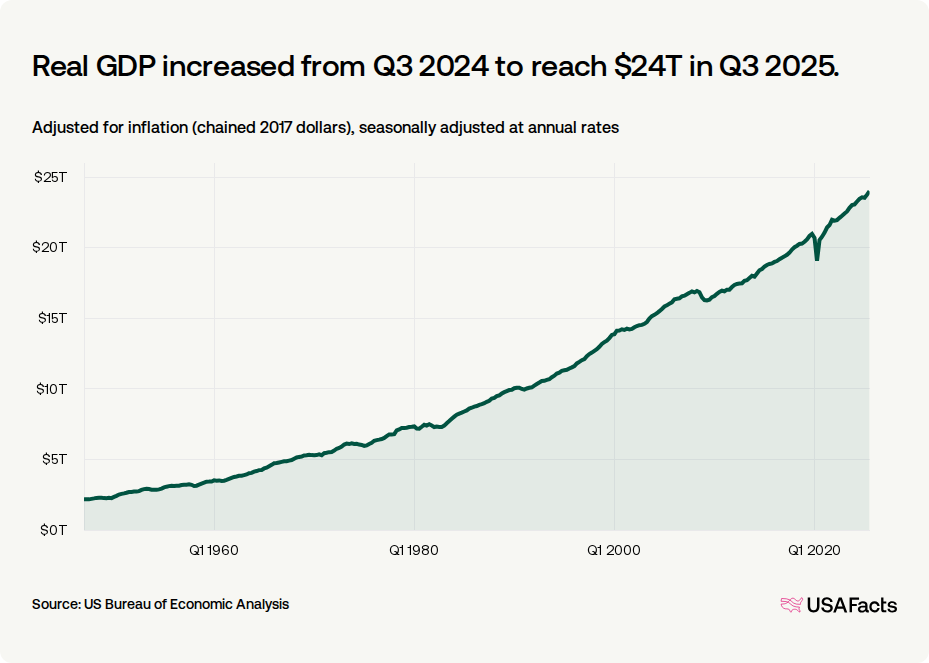
The gross domestic product (GDP) was $24.2 trillion in Q1 2026. GDP measures the value of goods and services a country or state produces — it’s the sum of consumer spending, business investment, government spending, and net exports. It is often used to quantify the size of its economy. The $24.2 trillion is the “real GDP,” which is adjusted to account for inflation to make it easier to compare the size of an economy over time.
$24.2T
Real GDP (Q1 2026)
+2.7%
Change in real GDP (Q1 2025 to Q1 2026)
Changes in spending and investment cause the GDP to fluctuate; the dip in GDP during the COVID-19 pandemic was due to a decrease in consumer spending, investment, and exports that was only slightly offset by increased government spending.
As of Q1 2026, the real GDP was $24.2 trillion, up 2.7% from Q1 in 2025.
Real GDP increased from Q1 2025 to reach $24.2T in Q1 2026.
Real gross domestic product, adjusted for inflation (chained 2017 dollars), seasonally adjusted at annual rates
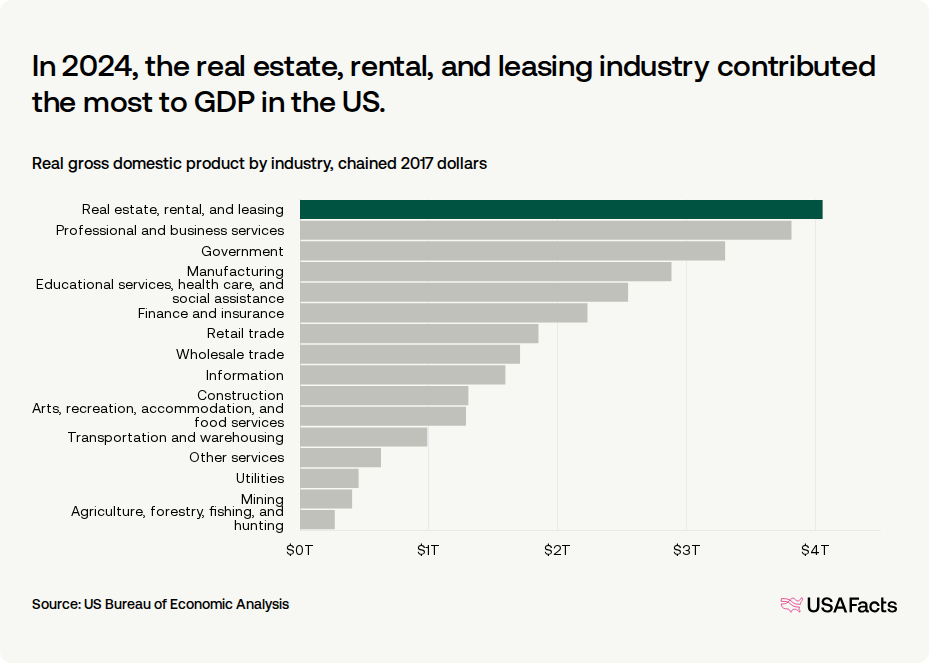
The GDP can also be broken down and compared across industries — useful, as different industries experience different economic pressures.
Which industry contributes the most to the GDP?
The real estate, rental, and leasing industry contributed the most to the national GDP in 2025, generating a value of $4.24 trillion, or about 13.8% of the GDP. It was followed by professional and business services (13.1%) and government (11.2%).
The five biggest industries in the US generated about 56.3% of the GDP in 2025.
In 2025, the real estate, rental, and leasing industry contributed the most to GDP in the US.
Gross domestic product, by industry (2025)
What is the GDP per capita?
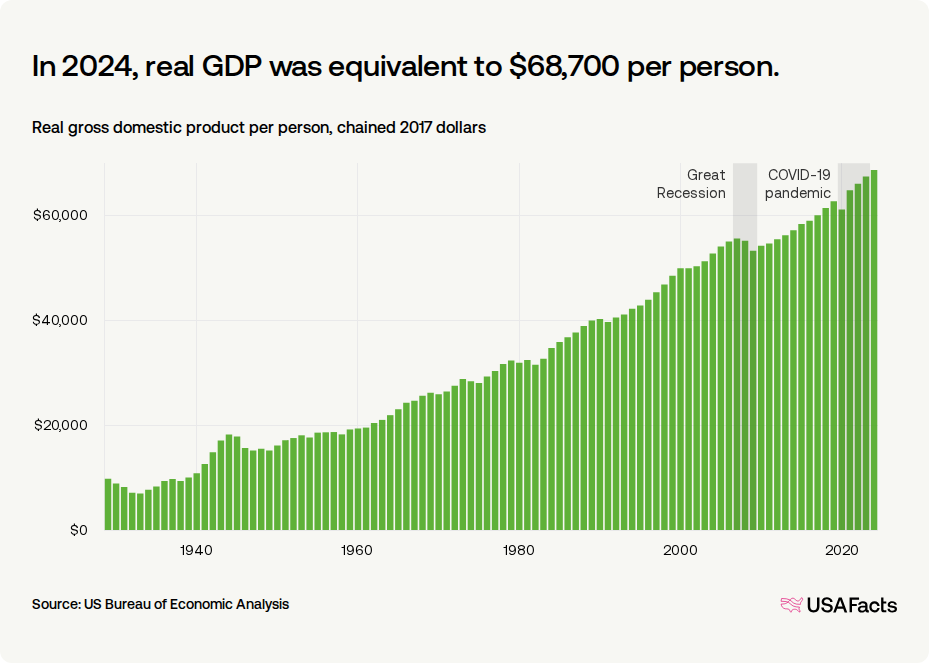
Another way to understand a population’s standard of living is by taking the GDP and dividing it by the total number of people in the population. This figure offers insight into the average economic output per individual. When the GDP per capita goes up, it suggests that individuals are becoming wealthier and/or resources are being used more efficiently. This helps economists understand whether economic growth is outpacing population growth.
In 2025, the US GDP per capita was $69,800, up 1.6% from 2024.
In 2025, real GDP was equivalent to $69,800 per person.
Real gross domestic product per capita, chained 2017 dollars, 1929–2025
What state has the highest GDP per capita?
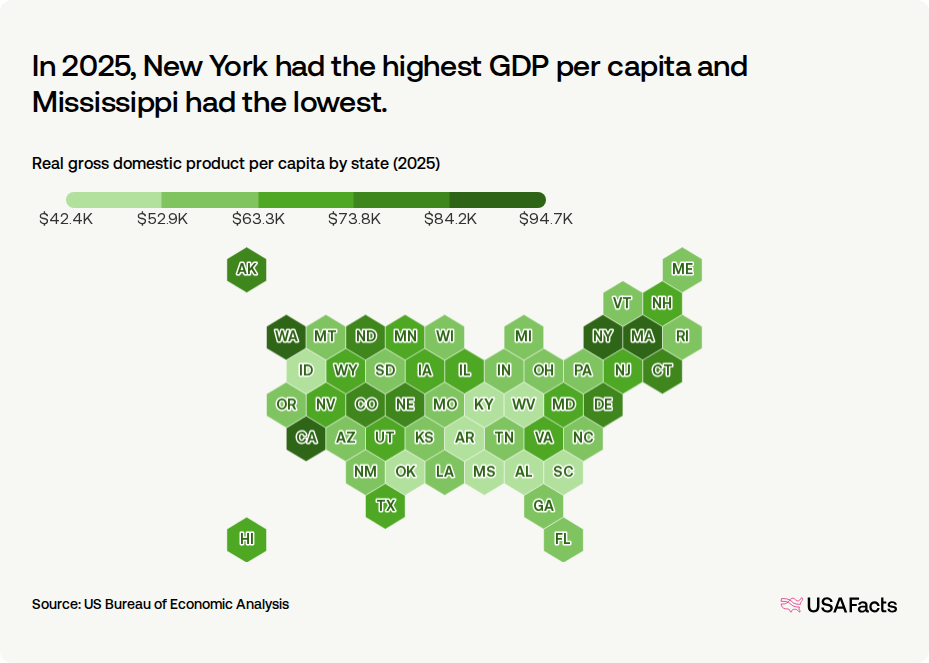
In 2025, the real (that is, inflation-adjusted) GDP per capita exceeded $85,000 in four states (New York, Massachusetts, Washington state, and California) and was less than $48,000 in two states (West Virginia and Mississippi).
GDP and the economic experience varies by location due to factors like cost of living, population density, workforce education, and the area’s main industries.
In 2025, New York had the highest GDP per capita and Mississippi had the lowest.
Real gross domestic product per capita by state (2025)
Real GDP per capita, by state (2025)
| 1. | New York | $94,702 |
| 2. | Massachusetts | $90,044 |
| 3. | Washington state | $89,679 |
| 4. | California | $86,110 |
| 5. | Delaware | $82,344 |
| 6. | North Dakota | $79,501 |
| 7. | Connecticut | $79,437 |
| 8. | Alaska | $77,974 |
| 9. | Colorado | $76,198 |
| 10. | Nebraska | $74,436 |
Keep exploring
Methodology
USAFacts standardizes data, in areas such as time and demographics, to make it easier to understand and compare.
Page sources
USAFacts endeavors to share the most up-to-date information available. We sourced the data on this page directly from government agencies; however, the intervals at which agencies publish updated data vary.

