What is the labor force participation rate in the US?
61.5%
-0.8
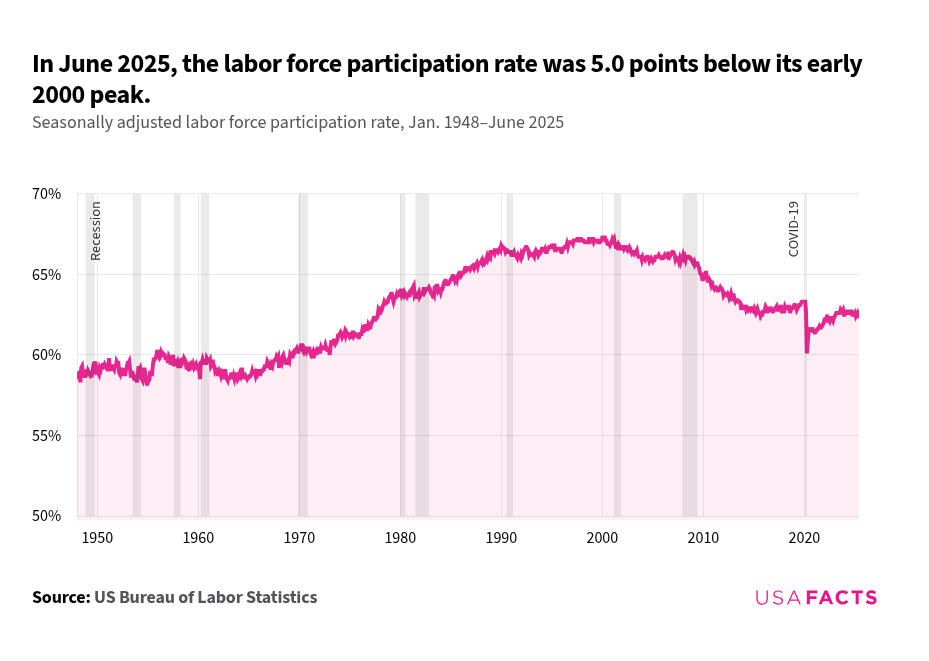
In June 2026, the labor force participation rate was 5.8 points below its early 2000 peak.
Seasonally adjusted labor force participation rate, January 1948–June 2026
Get weekly insights
Subscribe for data-driven insights. No spin, just the facts.
How does labor force participation differ between men and women?
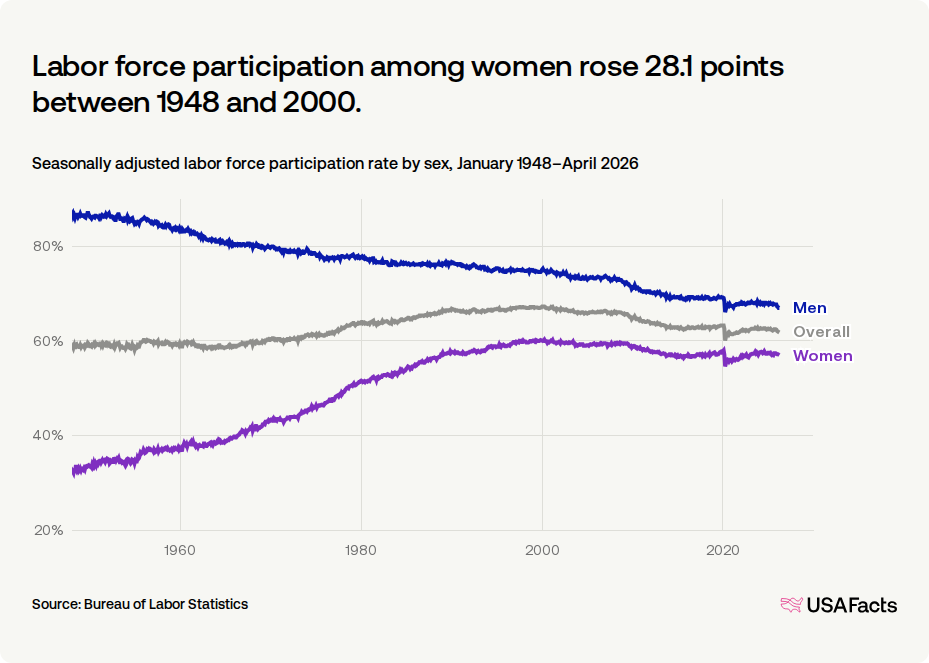
Labor force participation among women rose 28.1 points between 1948 and 2000.
Seasonally adjusted labor force participation rate by sex, January 1948–June 2026
How does labor force participation differ by age?
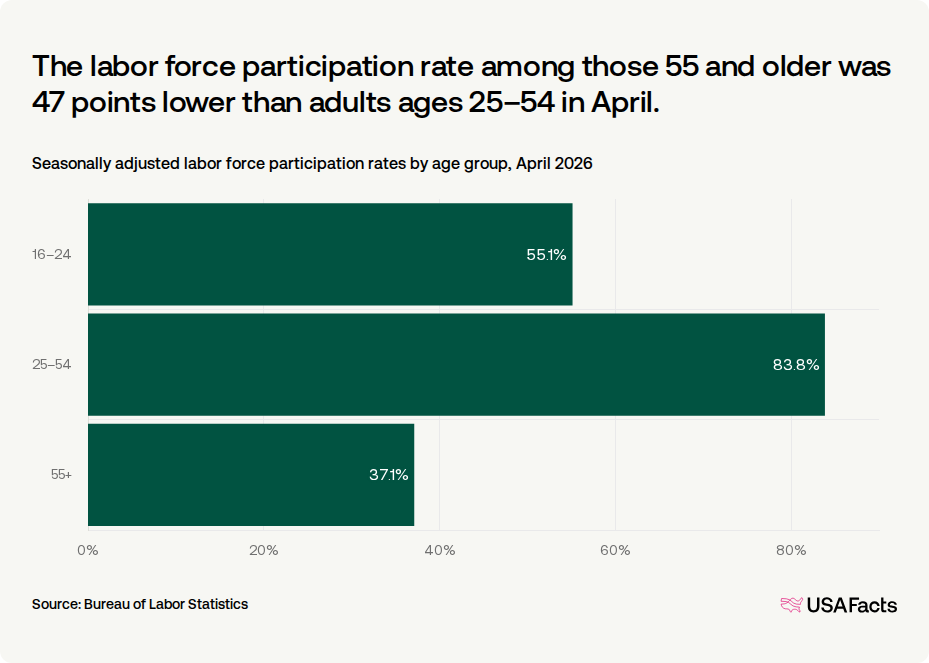
The Bureau of Labor Statistics attributes the decline in the labor force participation rate over recent decades primarily to the aging population. Older adults are less likely to work than younger ones. As older Americans comprise an increasing share of the population, labor force participation declines accordingly.
The labor force participation rate among those 55 and older was 46 points lower than adults ages 25–54 in June.
Seasonally adjusted labor force participation rates by age group, June 2026
Which states have the highest and lowest labor force participation?
In May, the most recent state-level data, the rate was as high as 69.8% in North Dakota and as low as 54% in West Virginia. It was 70.5% in Washington, DC, but the capital more closely resembles a city rather than a state. The rate varies nationwide as a result of varied demographics and economies.West Virginia had May 2026's lowest labor force participation rate.
Seasonally adjusted labor force participation rates by state, May 2026

Seasonally adjusted labor force participation rates, by state (May 2026)
| 1. | Washington, DC | 70.5% |
| 2. | North Dakota | 69.8% |
| 3. | Nebraska | 69.8% |
| 4. | Iowa | 67.4% |
| 5. | South Dakota | 67.3% |
| 6. | Kansas | 67.2% |
| 7. | Minnesota | 67.2% |
| 8. | Utah | 66.5% |
| 9. | Alaska | 66% |
| 10. | Colorado | 65.9% |
Steve Ballmer explains the US economy in 14 minutes
Keep exploring
Methodology
USAFacts standardizes data, in areas such as time and demographics, to make it easier to understand and compare.
Page sources
USAFacts endeavors to share the most up-to-date information available. We sourced the data on this page directly from government agencies; however, the intervals at which agencies publish updated data vary.
