What is the unemployment rate in the US right now?
Refreshed monthly
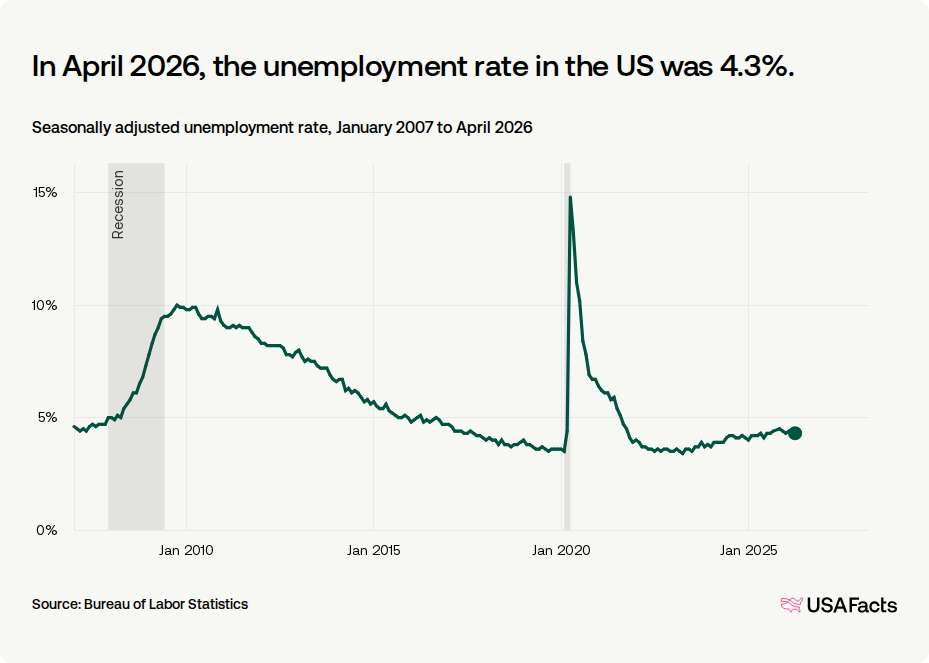
Unemployment was at 4.2% in June 2026. That's a 0.1 percentage point decrease from the prior month. The unemployment rate is the percentage of people in the labor force who are actively looking for work but not currently employed. It's a common way to measure the health of the job market and economy.
In June 2026,
4.2%
of the labor force was unemployed in the US
June 2026 had a
-0.1
percentage point change from the previous month
The Bureau of Labor Statistics calculates the unemployment rate through a monthly survey to identify the civilian labor force, meaning people who are employed or actively seeking work. It counts part-time workers as employed. It excludes people who aren’t actively looking for work, such as retirees or discouraged workers.
In June 2026, the unemployment rate in the US was 4.2%.
Seasonally adjusted unemployment rate, January 2007 to June 2026
What factors affect the unemployment rate?
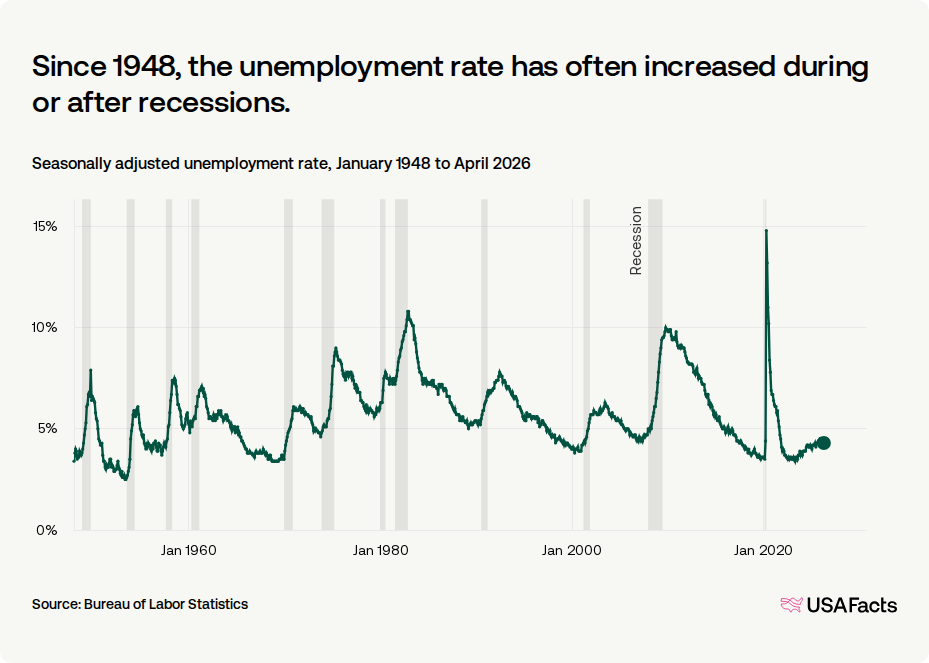
The unemployment rate historically has increased during or shortly after the start of a recession. As economic activity slows, demand for goods and services decreases, leading businesses to cut costs with layoffs or hiring freezes. The unemployment rate can also change based on the number of people joining or leaving the labor force.
Since 1948, the unemployment rate has often increased during or after recessions.
Seasonally adjusted unemployment rate, January 1948 to June 2026
Which states have the highest unemployment rates?
California, Oregon, and Washington state had the highest unemployment rates, as of May 2026. California’s unemployment rate was 5.3%. Oregon and Washington state were tied for highest at 5.2%.
Get weekly insights
Subscribe for data-driven insights. No spin, just the facts.
Comparing May 2026 with the previous month, Alabama had the largest increase, rising 0.2 percentage points from 2.8% to 3%.
In May 2026, the unemployment rate varied across states.
Seasonally adjusted unemployment rate, by state

How is the unemployment rate calculated?
The “official” US unemployment rate (often called U-3) is calculated each month from the Current Population Survey by taking the number of unemployed people who are:
That is divided by the labor force, which is everyone age 16+ who is either employed or unemployed. The result is Unemployed ÷ (Employed + Unemployed) × 100.
- age 16 or older
- don’t have a job
- available for work
- and actively looked for work in the last 4 weeks (including people on temporary layoff expecting recall)
That is divided by the labor force, which is everyone age 16+ who is either employed or unemployed. The result is Unemployed ÷ (Employed + Unemployed) × 100.
What other measures of unemployment are there?
There are alternative measures of unemployment because the “official” rate (U-3) doesn’t capture everyone who may want work but isn’t counted as unemployed under the strict definition. This includes:
- people who are working part time for economic reasons
- “marginally attached” or jobless people who haven’t sought employment in the last four weeks.
- “discouraged workers” who haven’t sought jobs because they don’t believe there are any jobs available for them
- U-1 (1.8%): Unemployed 15 weeks or longer (as a percent of the labor force)
- U-2 (1.9%): Job losers and people who completed temporary jobs (as a percent of the labor force)
- U-3 (4.2%) (official rate): Total unemployed (as a percent of the labor force)
- U-4 (4.5%): U-3 plus discouraged workers (as a percent of the labor force plus discouraged workers)
- U-5 (5.2%): U-4 plus all marginally attached workers (as a percent of the labor force plus marginally attached)
- U-6 (7.9%): U-5 plus people working part time for economic reasons (as a percent of the labor force plus marginally attached)
Unemployment rate, by state (May 2026)
| 1. | Washington, DC | 6.1% |
| 2. | California | 5.3% |
| 3. | Oregon | 5.2% |
| 4. | Washington state | 5.2% |
| 5. | Nevada | 5.2% |
| 6. | Connecticut | 5.1% |
| 7. | Michigan | 5.1% |
| 8. | Illinois | 5.1% |
| 9. | Delaware | 5.1% |
| 10. | New Mexico | 4.9% |
Keep exploring
Methodology
USAFacts standardizes data, in areas such as time and demographics, to make it easier to understand and compare.
Page sources
USAFacts endeavors to share the most up-to-date information available. We sourced the data on this page directly from government agencies; however, the intervals at which agencies publish updated data vary.
