There are 1.6 million Americans who identify as Pacific Islander, making up 0.49% of the population in 2023. From 2013 to 2023, the Pacific Islander population grew by 32.7%, or 400,000 people.
Asian Americans are sometimes grouped with Pacific Islanders under the “AAPI” umbrella and are jointly celebrated every May during Asian American and Pacific Islander Heritage Month. This population is diverse, with education and income varying widely between ethnic groups.
What are the different ethnic groups among Pacific Islanders?
There are three Pacific Islands regions: Polynesia, Micronesia, and Melanesia. Ethnicities are based on the island that a person’s family and ancestors originated from.
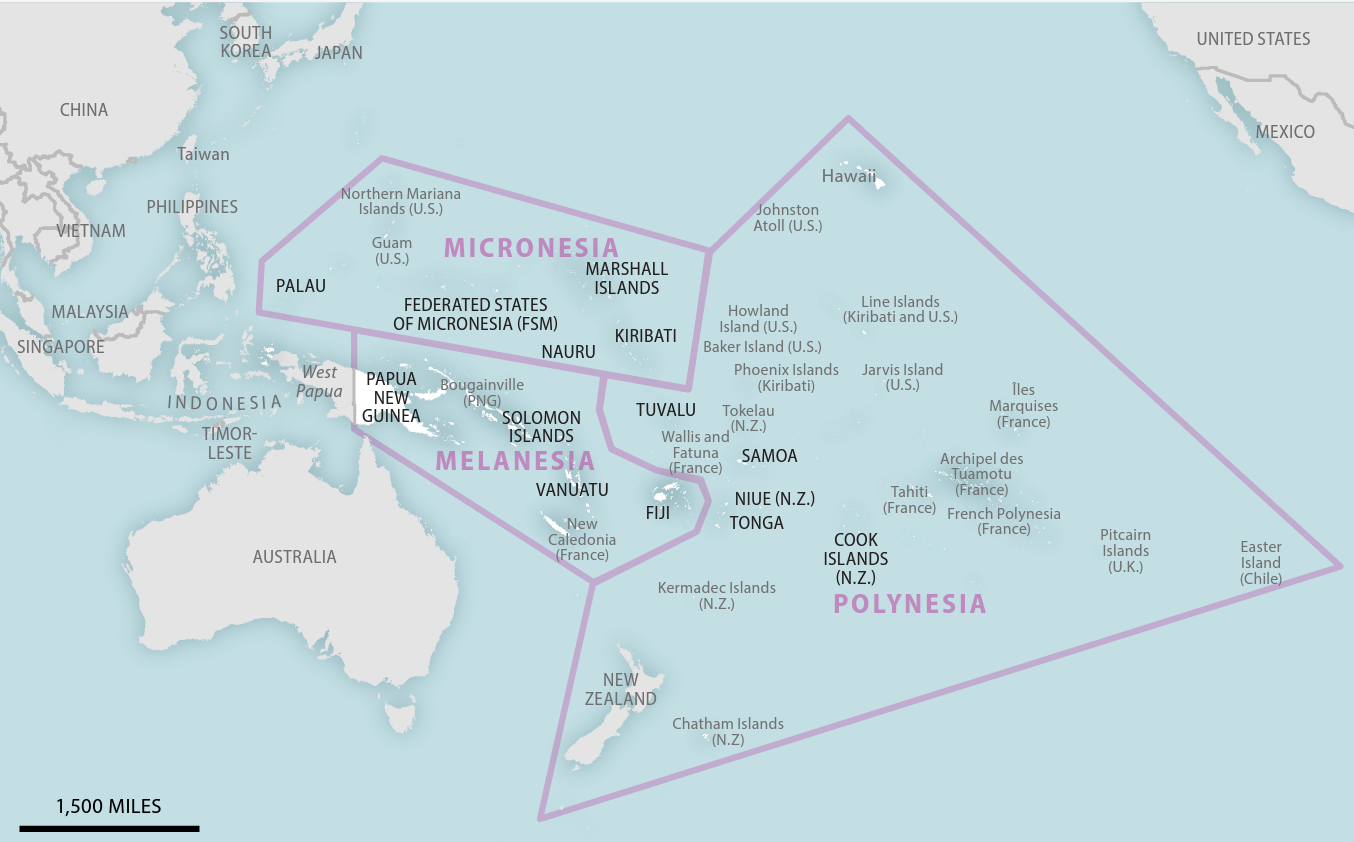
In the US, Native Hawaiians are the largest Pacific Islander ethnic group, followed by Samoans and Chamorros (descendants of the indigenous people of Guam.)
Which states have the highest Pacific Islander populations?
The Pacific Islander population is concentrated in a few US states. Over half live in Hawaii (389,000), California (330,000), and Washington (111,000).
Meanwhile, 23 states are home to less than 10,000 Pacific Islanders each.
What are college graduation rates among Pacific Islanders?
Pacific Islanders graduate from college at a rate of one in four (25.8%), compared to the nationwide rate of 35.7%.
Graduation rates also vary across ethnic groups. For example, 30.8% of Chamorro-Americans have received a bachelor’s degree, compared to the national average of 35.7%.
What are the socioeconomic trends among Pacific Islanders?
For people in the US identifying as Pacific Islander, the 2022 median household income is $76,421, just over the national median of $74,755. Tongans have the highest median household income at $86,675, 15.9% higher than the US median. Samoans, meanwhile, had the lowest median household income at $67,344, 9.9% lower than the US median.
Family poverty rates were higher than the national average. That year, 11.4% of Pacific Islanders lived in poverty, compared with 8.9% of the US population.
Pacific Islanders have higher housing costs than the general population. On average, Pacific Islander renters pay $248 more in rent and owners with mortgages pay $342 more than the average American. Homelessness rates among Pacific Islanders are 5.5 times higher than the US average.
Housing costs are 20% to 34% higher for renters and owners in California, Hawaii, and Washington, where more than half of the nation’s Pacific Islander population lives.
How does the government define “Pacific Islander"? Where does the data come from?
In 1997, the Office of Management and Budget outlined the current standards for federal data on race and ethnicity, which separated the “Asian or Pacific Islander” category into “Asian” and “Native Hawaiian or Other Pacific Islander.”
The Census Bureau, following these standards, defines a Pacific Islander as “a person having origins in any of the original peoples of Hawaii, Guam, Samoa, or other Pacific Islands.”
The agency has never had a checkbox for “Pacific Islander” in its official census forms. In 2020, the agency offered a checkbox for three Pacific Islander ethnic groups — Native Hawaiian, Samoan, Chamorro — along with a fourth “other Pacific Islander” category accompanied by a fill-in text area.
The latest available demographic data on Pacific Islanders comes from the 2022 and 2023 American Community Survey. Its economic and educational outcome breakdowns only analyze the nation’s largest Pacific Islander ethnic groups.
Learn more about diversity, how the Census defines "Some Other Race", and get the data straight to your inbox with our weekly newsletter.

