What is the value of US trade with ?

Updated Apr. 29, 2026Refreshed annually
$2.18 billion in imports and $1.81 billion in exports in 2025. That means that the US imported $369 million more from Bahrain than we exported to it. Benefits of trade can include higher wages and job growth, a wider variety of products available at lower prices, increased productivity, and more efficient resource allocation.

$2.18B

Value of imports from Bahrain to the US (2025)

$1.81B

Value of exports from the US to Bahrain (2025)
Exports are goods and services the US sells to other countries. Imports are goods and services the US buys from other countries. Combining the value of imports and exports shows us how much trade happens between the US and other countries.
The Bureau of Economic Analysis (BEA) provides data for 71 of the US' trading partners (though not necessarily the top 71 trading partners). The partners they track accounted for 94.2% of total trade with the US in 2025.

How high is Bahrain ranked as a US trade partner?

BEA data ranks Bahrain as the US’ 65th top trading partner: In 2025, the US traded $3.99 billion in goods and services with Bahrain. Countries with similar trade values include Slovenia ($4.04B) and Bulgaria ($3.98B).

In 2025, the US traded $3.99 billion in goods and services with Bahrain.

Total trade value (imports + exports) with the US (2025), by select countries

Ask the data
Beta

We use AI to summarize the data, charts, and analysis we have on USAFacts

Another way to look at international trade is through trade balance. A nation that imports more than it exports, has a trade deficit. One that exports more than it imports has a trade surplus. Neither is inherently good or bad; trade balance is just a metric that shows the relationship between imports and exports.

What is the trade balance with Bahrain?

The US had a trade deficit with Bahrain in 2025. The 2025 deficit was $369 million, an increase from 2024's deficit of $83 million.

The trade deficit with Bahrain increased to $369M in 2025.

Annual trade balance with Bahrain, not adjusted for inflation

What does the US import from Bahrain?

In 2025, 57.9% of imports from Bahrain to the US were goods. The largest category was industrial supplies and materials (items used up in the production process, like oil, chemicals, and plastic), accounting for $1.12 billion. The top three imports were industrial supplies and materials, consumer goods (goods and services purchased by individuals for personal use, like clothing and cellphones), and other merchandise. These categories accounted for $1.25 billion of total imports.
The other 42.1% were services, with government goods and services being the largest service category. Government goods and services accounted for $533 million.

Industrial supplies and materials made up 51.3% of US imports from Bahrain in 2025.

US imports from Bahrain by category (2025)

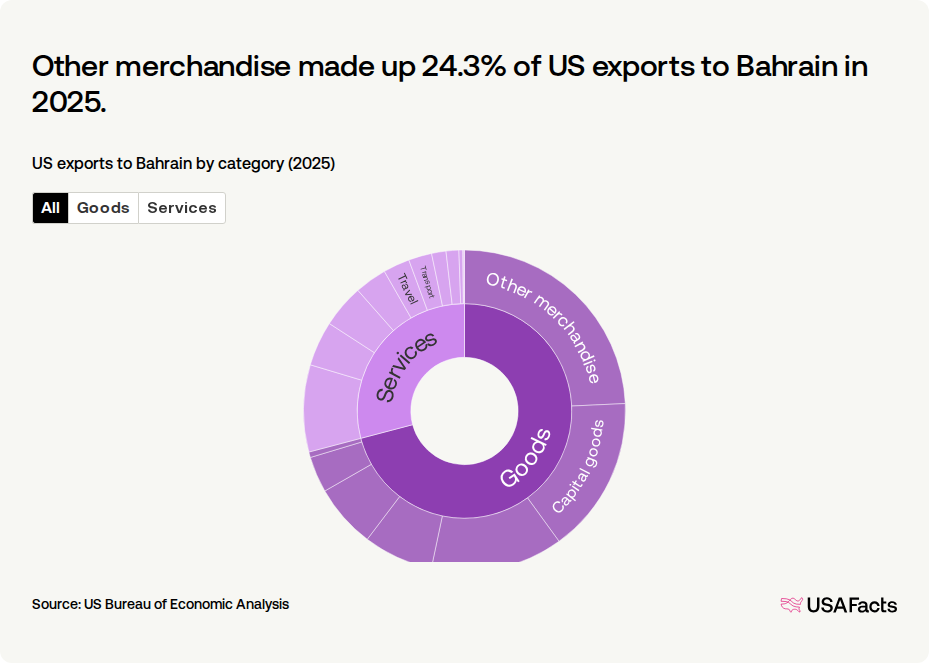
What does the US export to Bahrain?

In 2025, more US exports to Bahrain were goods — 71.6%. The largest export was other merchandise, which accounted for a value of $436 million. The top three exports were other merchandise, capital goods (tools used for the production process, like machinery and equipment), and industrial supplies and materials. These categories accounted for $982 million of exports to Bahrain.
The other 28.4% were services, with financial services being the largest service category. Financial services (services normally provided by banks and other financial institutions) accounted for $159 million.

Other merchandise made up 24.1% of US exports to Bahrain in 2025.

US exports to Bahrain by category (2025)

Value of imports and exports, by category (2025)

Value of imports and exports, by category (2025)
1.

Industrial supplies and materials

$1.12 billion
2.

Government goods and services

$533 million
3.

Business services

$184 million
4.

Telecommunications and information services

$72 million
5.

Consumer goods

$70 million
6.

Other merchandise

$60 million
7.

Travel 

$45 million
8.

Transport 

$36 million
9.

Capital goods

$7 million
10.

Food, feeds, and beverages

$7 million

Keep exploring

Methodology

USAFacts standardizes data, in areas such as time and demographics, to make it easier to understand and compare.

The analysis was generated with the help of AI and reviewed by USAFacts for accuracy.

Page sources

USAFacts endeavors to share the most up-to-date information available. We sourced the data on this page directly from government agencies; however, the intervals at which agencies publish updated data vary.