What is the current inflation rate of the Midwest region of the US?
Refreshed monthly
The inflation rate was 4.1%, as of April 2026. The annual inflation rate measures the difference in prices in one month to the same month a year before. While several government datasets track price changes, the Consumer Price Index (CPI) represents the spending habits of people living in urban areas, or about 90% of the US population. In addition to reporting inflation representing the spending of all urban Americans, the CPI also provides area-specific measures of inflation. The latest CPI data shows that the Midwest region has higher inflation than the US overall.
4.1%
headline inflation rate, all items (April 2025 to April 2026)
3.8%
annual inflation rate, all items in all urban areas in the US (April 2025 to April 2026)
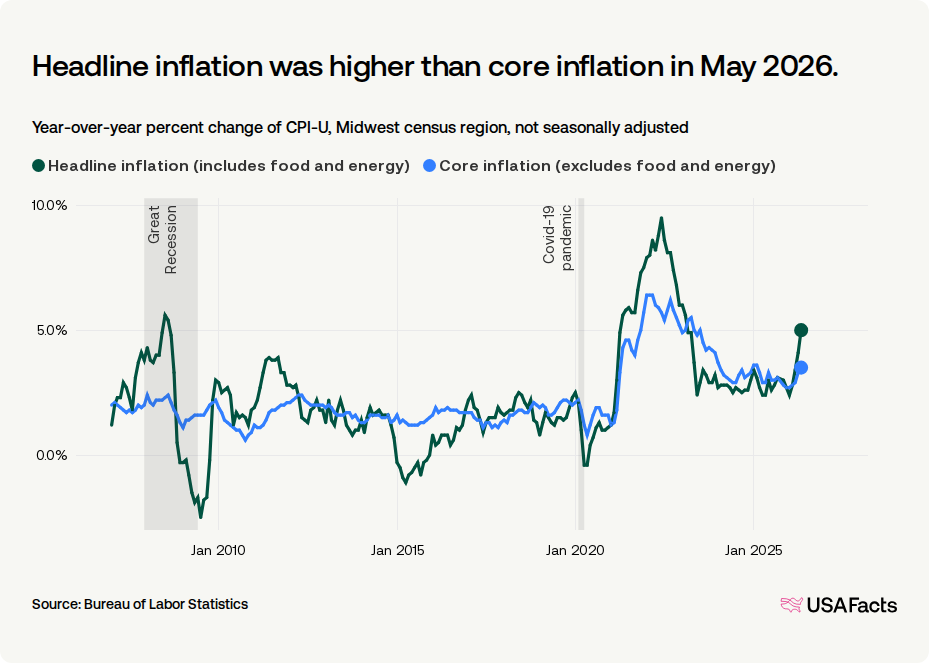
There are multiple ways to measure inflation. Headline inflation includes all consumer spending categories, such as food, housing, and transportation, offering a broad view of the overall cost of living. However, because food and energy prices can be highly volatile due to factors like weather or supply chain disruptions, core inflation excludes these categories.
In April 2026, the Midwest region had a headline inflation rate of 4.1% and core inflation of 3.3%. Core inflation was lower than headline. That means food and energy had higher price increases over the previous year compared to other goods and services.
Headline inflation was higher than core inflation in April 2026.
Year-over-year percent change of CPI-U, Midwest census region, not seasonally adjusted
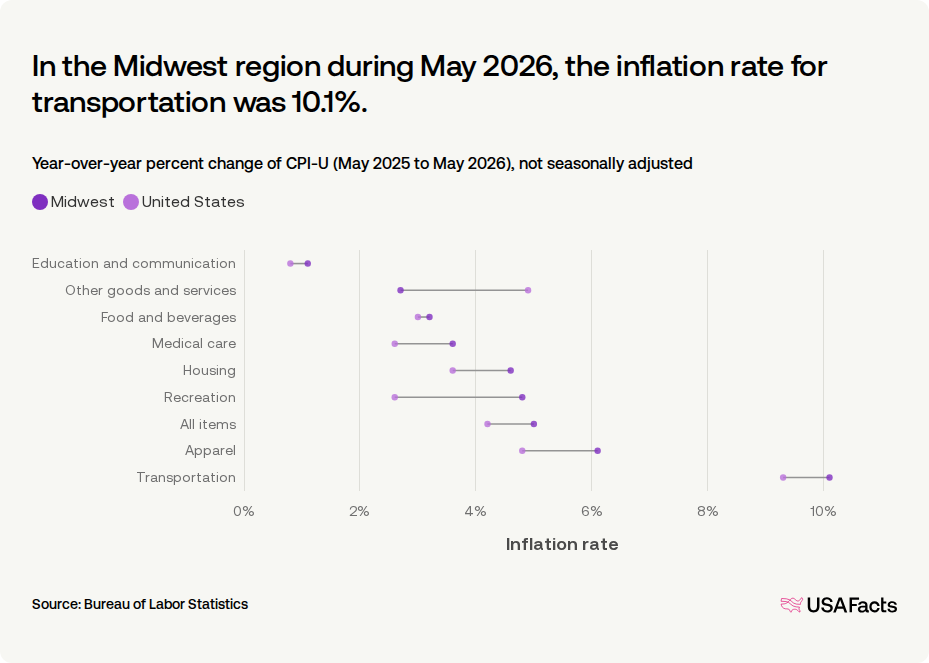
Headline inflation in the Midwest region was higher than the national average for all urban areas. Midwest price increases were higher in four CPI categories: Apparel, Housing, Medical care, and Recreation. Of those, Recreation inflation differed most between the region and the rest of the country. The annual inflation rate for Recreation was 4.2% in the region, compared with 2.3% across the US.
In the Midwest region during April 2026, the inflation rate for transportation was 5.8%.
Year-over-year percent change of CPI-U (April 2025 to April 2026), not seasonally adjusted
Census regions are a common way the federal government groups states for data collection. The Midwest region includes the following states: Illinois, Indiana, Michigan, Ohio, Wisconsin, Iowa, Kansas, Minnesota, Missouri, North Dakota, Nebraska, and South Dakota.
The lowest headline inflation across the four census regions of the US was 3.5% in the West. The highest was 4.4% in the Northeast.
Among the four census regions of the US, the West had the lowest headline inflation rate.
Year-over-year percent change of CPI-U (April 2025 to April 2026), not seasonally adjusted

Keep exploring
Methodology
USAFacts standardizes data, in areas such as time and demographics, to make it easier to understand and compare.
The analysis was generated with the help of AI and reviewed by USAFacts for accuracy.
Page sources
USAFacts endeavors to share the most up-to-date information available. We sourced the data on this page directly from government agencies; however, the intervals at which agencies publish updated data vary.
