What is the crime rate in New Jersey?
218
1,427
In 2024, both the violent and property crime rates in New Jersey were lower than the US average.
Property and violent crimes per 100,000 people

- Murder and non-negligent manslaughter
- Rape
- Robbery (the FBI defines this as “... taking or attempting to take something of value from a victim ... by the use of force or threat of force ...”; the victim must be present).
- Aggravated assault
- Burglary (the FBI defines this as “the unlawful entry into a building or some other structure to commit a felony or a theft”).
- Larceny-theft, often called stealing (the FBI defines this as “the unlawful taking, carrying, leading, or riding away of property from the possession or constructive possession of another person”).
- Motor vehicle theft (not included in larceny-theft)
How high is violent crime in New Jersey compared to other states?
The violent crime rate in New Jersey was 69.9% lower than in Alaska, which had the highest rate.
Violent crimes per 100,000 people, 2024

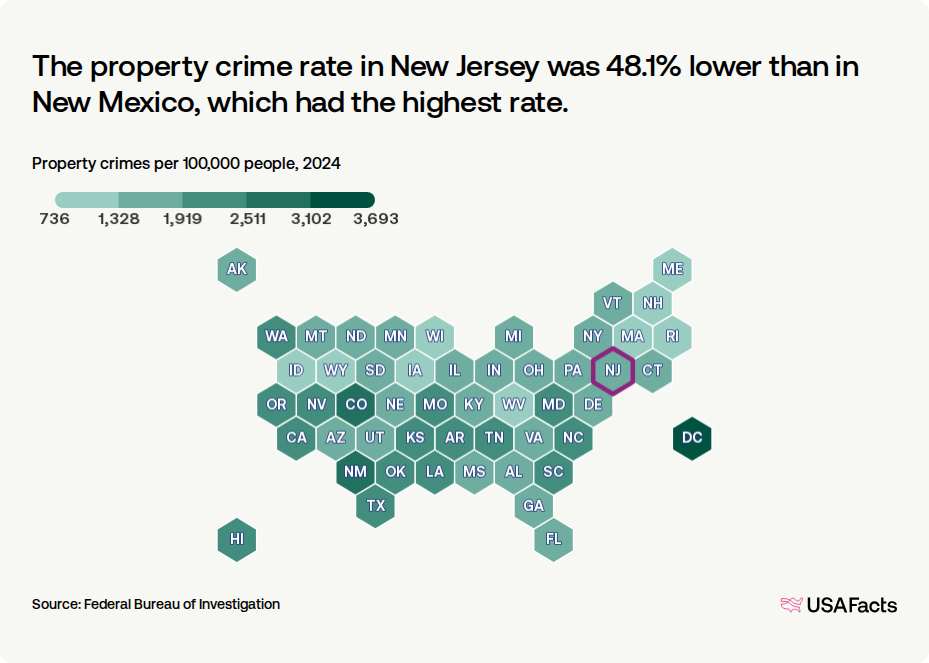
How high is property crime in New Jersey compared to other states?
The property crime rate in New Jersey was 48.1% lower than in New Mexico, which had the highest rate.
Property crimes per 100,000 people, 2024
Has the crime rate in New Jersey gone up or down?
Between 2023 and 2024, the overall crime rate increased in 2 states.
Change in total offenses per 100,000 people, 2023 vs. 2024

Change in 2024 crime rate from prior year
| 1. | Murder | -20.7% |
| 2. | Rape | -5.5% |
| 3. | Robbery | -5.4% |
| 4. | Assault | -2.1% |
| 5. | Burglary | -7.7% |
| 6. | Larceny-theft | -5.1% |
| 7. | Motor vehicle theft | -14.8% |
| 8. | All violent crime | -3.4% |
| 9. | All property crime | -6.6% |
| 10. | Overall crime rate | -6.2% |
Detailed 2024 crime rate comparison, offenses per 100,000
| 1. | Murder | 2 |
| 2. | Rape | 17 |
| 3. | Robbery | 49 |
| 4. | Assault | 149 |
| 5. | Burglary | 145 |
| 6. | Larceny-theft | 1,119 |
| 7. | Motor vehicle theft | 163 |
| 8. | All violent crime | 218 |
| 9. | All property crime | 1,427 |
| 10. | Overall crime rate | 1,645 |
Keep exploring
Methodology
USAFacts standardizes data, in areas such as time and demographics, to make it easier to understand and compare.
The analysis was generated with the help of AI and reviewed by USAFacts for accuracy.
Page sources
USAFacts endeavors to share the most up-to-date information available. We sourced the data on this page directly from government agencies; however, the intervals at which agencies publish updated data vary.