In 2024, for every 100,000 people, the violent crime rate was 462 and the property crime rate was 1,941. Simply speaking, violent crimes are committed against people, property crimes are not. These crime rates do not include every violent and property crime, but rather four violent offenses and three property offenses that have been tracked since 1929.
462
violent crimes per 100K people (2024)
1,941
property crimes per 100K people (2024)
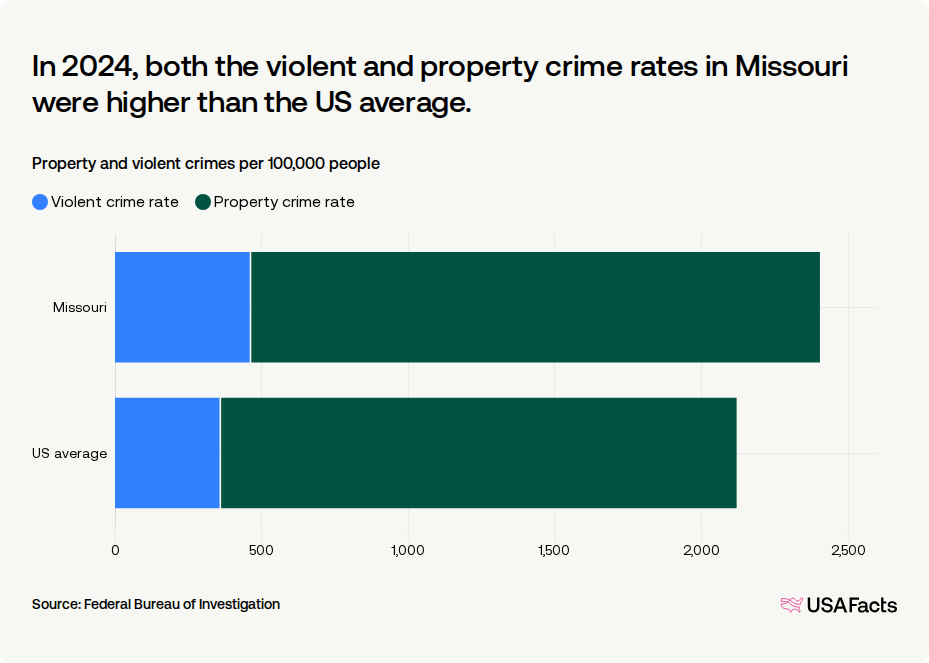
Compared to the US average, the violent crime rate in 2024 in Missouri was 28.7% higher, and its rate of property crime was 10.3% higher.
In 2024, both the violent and property crime rates in Missouri were higher than the US average.
Property and violent crimes per 100,000 people
Violent crimes involve force or the threat of force, and include:
Murder and non-negligent manslaughter
Rape
Robbery (the FBI defines this as “... taking or attempting to take something of value from a victim ... by the use of force or threat of force ...”; the victim must be present).
Aggravated assault
Property crimes involve the taking of money or property without force or the threat of it, and include:
Burglary (the FBI defines this as “the unlawful entry into a building or some other structure to commit a felony or a theft”).
Larceny-theft, often called stealing (the FBI defines this as “the unlawful taking, carrying, leading, or riding away of property from the possession or constructive possession of another person”).
Motor vehicle theft (not included in larceny-theft)
How high is violent crime in Missouri compared to other states?
Missouri ranked eighth among states for violent crime rates (462 offenses per 100,000 people). The rate was highest in Alaska (724 offenses per 100,000 people) and lowest in Maine (100).
The violent crime rate in Missouri was 36.2% lower than in Alaska, which had the highest rate.
Violent crimes per 100,000 people, 2024
In 2024 in Missouri, 77.4% of all violent crimes were aggravated assaults; 11.1%, robberies; 9.8%, rapes; and 1.7%, murders.
How high is property crime in Missouri compared to other states?
Missouri ranked 16th among states for property crime rates (1,941 offenses per 100,000 people). The rate was highest in New Mexico (2,751 offenses per 100,000 people) and lowest in Idaho (736).
The property crime rate in Missouri was 29.4% lower than in New Mexico, which had the highest rate.
Property crimes per 100,000 people, 2024
In 2024 in Missouri, 67.3% of all property crimes were larceny-thefts; 20.5%, motor vehicle thefts; and 12.2%, burglaries.
Has the crime rate in Missouri gone up or down?
Adding together property and violent crime creates an overall crime rate that enables us to examine general crime trends. Between 2023 and 2024, the overall crime rate in Missouri decreased by 8.6%. State-level changes ranged from a 16.4% decrease in the overall crime rate in Nebraska to a 0.78% increase in Maine. Across all states, the average overall crime rate decreased by 8.4% from the previous year. Also factored into the state average rate is Washington, DC, where the rate decreased 13%.
Between 2023 and 2024, the overall crime rate increased in 2 states.
Change in total offenses per 100,000 people, 2023 vs. 2024
Examining the crimes that drive changes to the overall crime rate, the violent crime rate in 2024 in Missouri went down 1.9% (versus a 5.4% decrease in the 50-state average) and the property crime rate grew 10% (versus a 9% decrease in the 50-state average). Of the seven offenses that comprise violent and property crime, burglary, larceny-theft, murder, motor vehicle theft, rape, and robbery rates in Missouri went up, while the incidence of the other offenses went down.
Change in 2024 crime rate from prior year
Change in 2024 crime rate from prior year
1.
Murder
Change from prior year
-17%
2.
Rape
Change from prior year
-10.7%
3.
Robbery
Change from prior year
-5%
4.
Assault
Change from prior year
+0.17%
5.
Burglary
Change from prior year
-8.4%
6.
Larceny-theft
Change from prior year
-7.3%
7.
Motor vehicle theft
Change from prior year
-18.7%
8.
All violent crime
Change from prior year
-1.9%
9.
All property crime
Change from prior year
-10%
10.
Overall crime rate
Change from prior year
-8.6%
The number of offenses per 100,000 people in 2024 also varies across the country.
Detailed 2024 crime rate comparison, offenses per 100,000
Detailed 2024 crime rate comparison, offenses per 100,000
1.
Murder
Offenses per 100K
8
2.
Rape
Offenses per 100K
45
3.
Robbery
Offenses per 100K
52
4.
Assault
Offenses per 100K
358
5.
Burglary
Offenses per 100K
236
6.
Larceny-theft
Offenses per 100K
1,307
7.
Motor vehicle theft
Offenses per 100K
398
8.
All violent crime
Offenses per 100K
462
9.
All property crime
Offenses per 100K
1,941
10.
Overall crime rate
Offenses per 100K
2,403
Keep exploring
Methodology
USAFacts standardizes data, in areas such as time and demographics, to make it easier to understand and compare.
The analysis was generated with the help of AI and reviewed by USAFacts for accuracy.
Page sources
USAFacts endeavors to share the most up-to-date information available. We sourced the data on this page directly from government agencies; however, the intervals at which agencies publish updated data vary.