What are the biggest drivers of inflation in the past year?
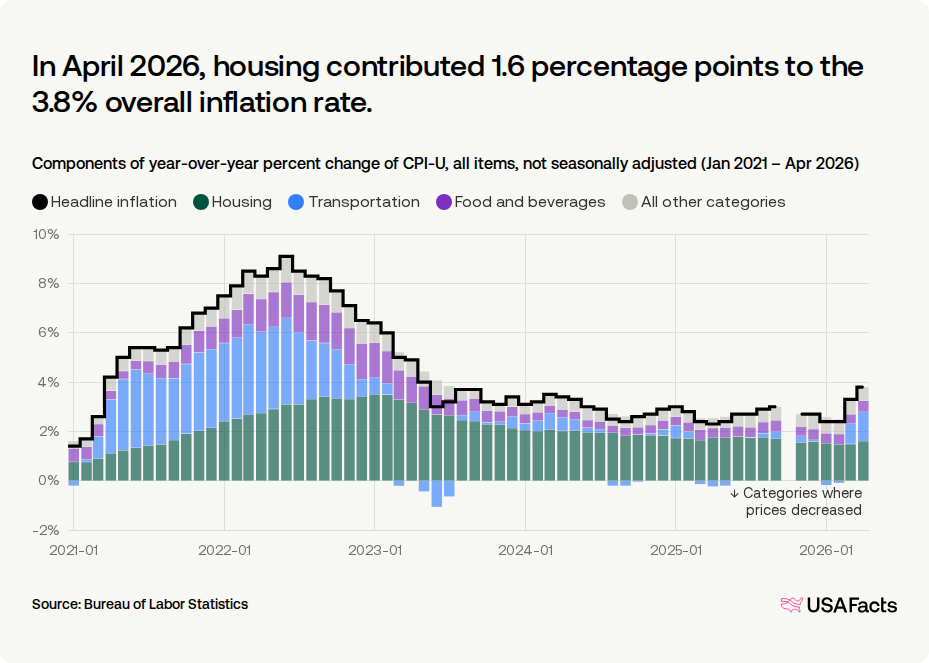
Housing was the main driver of inflation from June 2025 to June 2026. As of June 2026, overall prices increased 3.5% over the previous year. Of this, 1.5 percentage points came from price increases in housing, or about two-fifths of it.
The inflation rate is calculated using the Consumer Price Index (CPI), which tracks the price changes of a consistent basket of goods and services over time. Each item in this basket is given a weight that reflects how much the average urban household spends on it. Items with higher weights, like shelter, tend to have a greater impact on the overall inflation rate than other categories. By examining the price changes across different categories, we can better understand the factors contributing to the current inflation rate.
3.5%
2/5
- apparel
- education and communication
- food and beverages
- housing
- medical care
- recreation
- transportation
- other goods and services
Get weekly insights
Subscribe for data-driven insights. No spin, just the facts.
In June 2026, housing contributed 1.5 percentage points to the 3.5% overall inflation rate.
Components of year-over-year percent change of CPI-U, all items, not seasonally adjusted (Jan 2021 – Jun 2026)
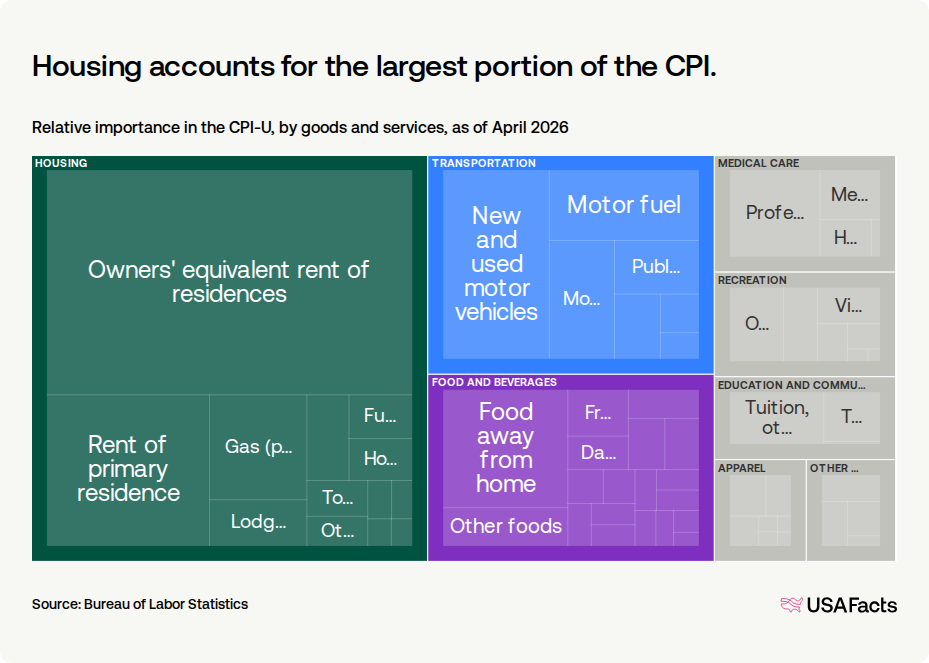
What share of the CPI does each category have?
The weight assigned to each category reflects its relative importance in a typical household’s budget, determined based on surveys of more than 20,000 households and individuals. Housing, which includes shelter, utilities, and household operations, holds the largest share of the CPI. Transportation has the second-highest weight, while food and beverages are third.Housing accounts for the largest portion of the CPI.
Relative importance in the CPI-U, by goods and services, as of June 2026
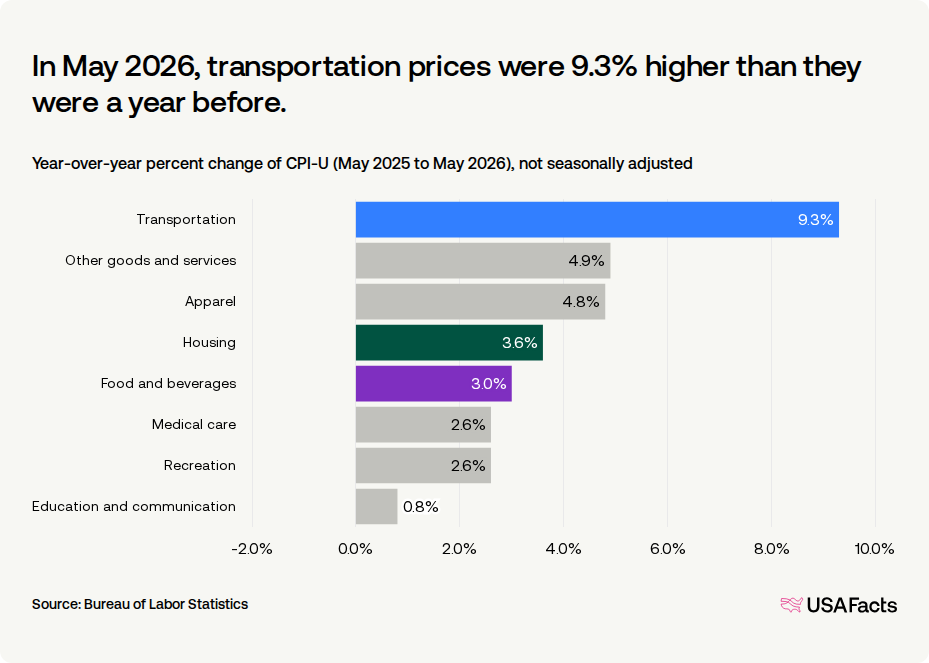
How have prices changed over the last year?
Regardless of the importance of categories within the CPI, looking at the inflation rate of each category can provide an understanding of how much prices are increasing or decreasing.In June 2026, transportation prices were 6.5% higher than they were a year before.
Year-over-year percent change of CPI-U (Jun 2025 to Jun 2026), not seasonally adjusted
Steve Ballmer explains the US economy in 14 minutes
Keep exploring
Methodology
USAFacts standardizes data, in areas such as time and demographics, to make it easier to understand and compare.
Page sources
USAFacts endeavors to share the most up-to-date information available. We sourced the data on this page directly from government agencies; however, the intervals at which agencies publish updated data vary.