Is Indiana's population growing or shrinking?
+38.6K
+0.56%
Indiana gained 38,600 residents between 2024 and 2025.
Annual population change, 1901–2025

What contributes to population change in Indiana?
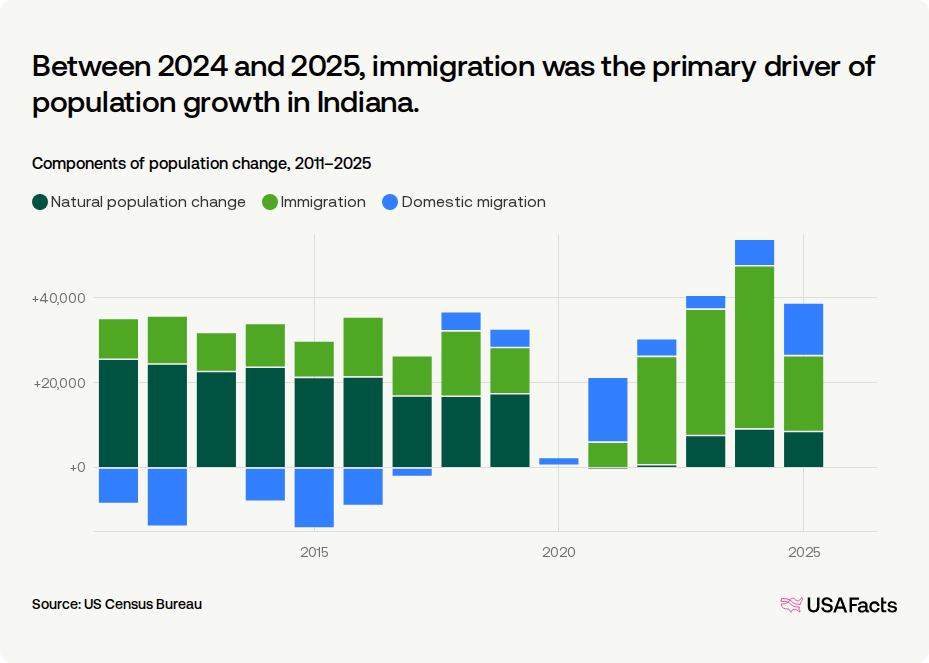
- Natural population change: If births outnumber deaths in a given year, natural population growth is positive. If deaths exceed births, it is negative. Between 2024 to 2025 natural population change was positive in Indiana, with births exceeding deaths by 8,600.
- Immigration: international migration directly into or out of a state. If more people move in than move out, population change from immigration is positive. If more people move out than move in, it’s negative. Indiana’s population change from immigration was positive, with about 17,900 more people coming from another country to Indiana than leaving.
- Domestic migration, moving between states: Indiana’s population change from domestic migration was positive, with about 12,200 more people moving to Indiana from other states than leaving.
Between 2024 and 2025, immigration was the primary driver of population growth in Indiana.
Components of population change, 2011–2025
Which counties in Indiana are growing? Which are shrinking?
Get weekly insights
Subscribe for data-driven insights. No spin, just the facts.
Between 2024 and 2025, Boone County gained 2.6% in population, the largest increase in Indiana.
Population change

How does population change in Indiana compare to other states?
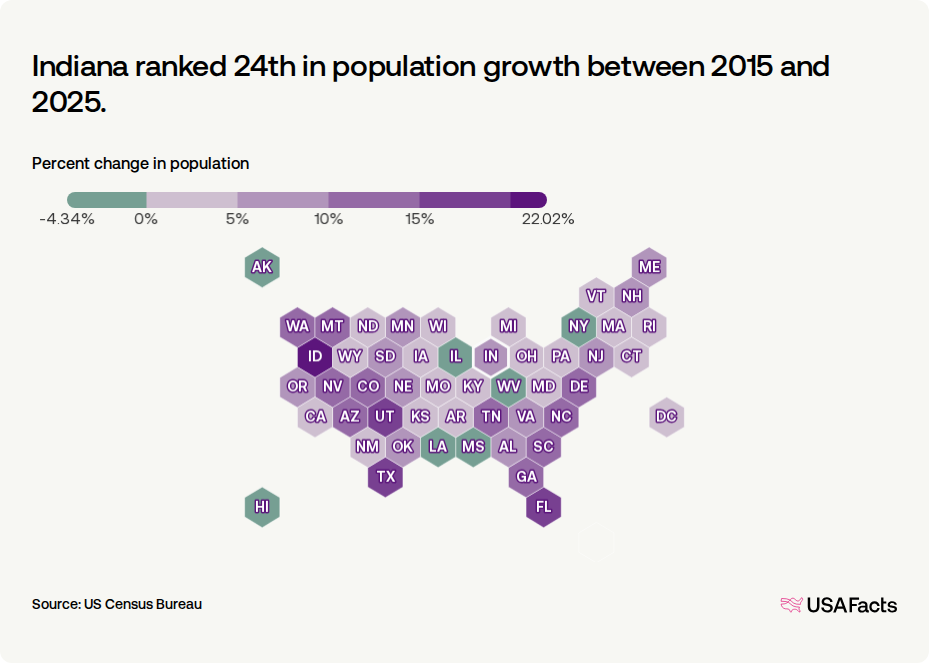
Indiana ranked 24th in population growth between 2015 and 2025.
Percent change in population
Population change between 2024 and 2025, by county in Indiana
| County | Population change rate | |
|---|---|---|
| 1. | Boone County, IN | +2.6% |
| 2. | Hancock County, IN | +2.4% |
| 3. | Clark County, IN | +2.1% |
| 4. | Hamilton County, IN | +1.9% |
| 5. | Johnson County, IN | +1.9% |
| 6. | Hendricks County, IN | +1.4% |
| 7. | Morgan County, IN | +1.2% |
| 8. | Madison County, IN | +1.1% |
| 9. | Parke County, IN | +1.1% |
| 10. | Owen County, IN | +1.1% |
Population change between 2015 and 2025, by state
| State | Population change rate | |
|---|---|---|
| 1. | Idaho | +22% |
| 2. | Utah | +17.9% |
| 3. | Florida | +16.5% |
| 4. | Texas | +15.8% |
| 5. | Nevada | +14.9% |
| 6. | South Carolina | +14.8% |
| 7. | Arizona | +13.7% |
| 8. | North Carolina | +12.4% |
| 9. | Delaware | +12.2% |
| 10. | Washington state | +11.4% |
How is the US population changing?
Keep exploring

Methodology
USAFacts standardizes data, in areas such as time and demographics, to make it easier to understand and compare.
Page sources
USAFacts endeavors to share the most up-to-date information available. We sourced the data on this page directly from government agencies; however, the intervals at which agencies publish updated data vary.
