How much do teachers get paid in the US?
$65.1K
$104K
High school teachers earn $72,300 annually, more than any other teachers
Median annual salary of elementary and secondary school teachers, excluding teachers of students with disabilities and technical teachers (All US, 2025)

Do public or private schools pay teachers more?
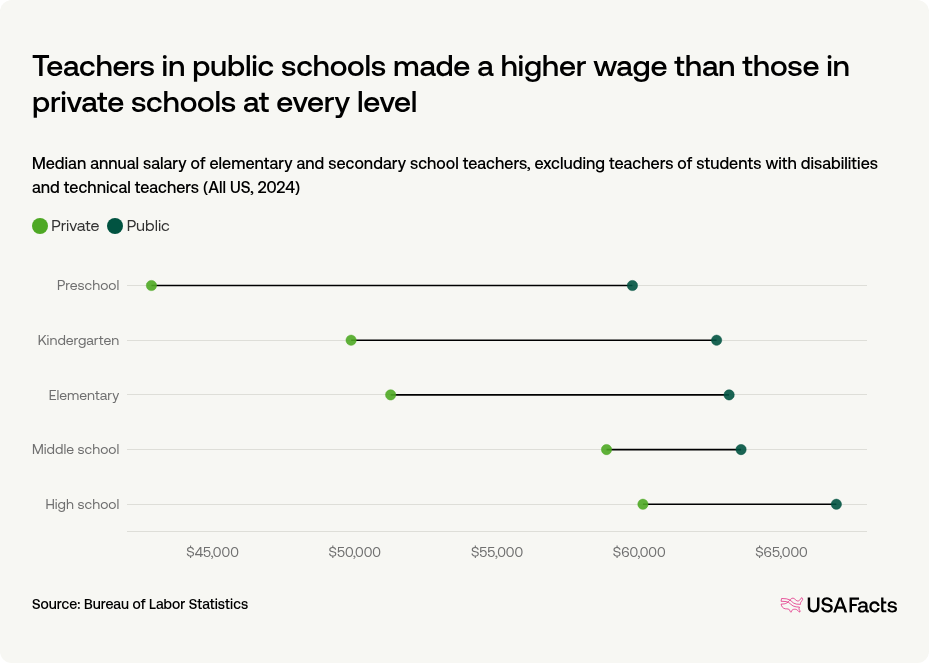
Teacher salaries also differ between public and private schools. In 2025, teachers in public schools earned a median wage of $66,400 per year, while teachers in private schools earned $59,700. These differences may reflect how the two types of schools are funded and managed.
Public schools receive funding from federal, state, and local governments and are often required to meet state certification and pay standards for teachers. Private schools rely more on tuition and other private sources of funding and may have different certification requirements for their teachers.
Teachers in public schools made a higher wage than those in private schools at every level
Median annual salary of elementary and secondary school teachers, excluding teachers of students with disabilities and technical teachers (All US, 2025)
How much do special education teachers make? What about technical education teachers?
Get weekly insights
Subscribe for data-driven insights. No spin, just the facts.
Teachers of students with disabilities tend to earn a higher median wage than other teachers at every grade level
Median annual salary of elementary and secondary school teachers (All US, 2025)

Which states pay teachers the most and least?
- Among states, preschool teachers earn the highest median salary in Alaska at $77,000 and the lowest in Alabama at $34,100. Washington, DC had higher salaries than any state at $97,400.
- Kindergarten teachers earn the highest median salary in Washington at $100,200 and the lowest in Montana at $47,700.
- Elementary school teachers earn the highest median salary in Washington at $102,400 and the lowest in Oklahoma at $48,200.
- Middle school teachers earn the highest median salary in Washington at $102,200 and the lowest in Oklahoma at $48,400.
- High school teachers earn the highest median salary in Washington at $102,700 and the lowest in Oklahoma at $48,700.
Preschool teachers earn the most in District of Columbia; Washington state leads for all other grades
Median annual salary of elementary and secondary school teachers, excluding teachers of students with disabilities and technical teachers (2025)

Preschool teachers earn the highest adjusted pay in District of Columbia; Washington state leads adjusted pay for all other grades
Median annual salary of elementary and secondary school teachers, excluding teachers of students with disabilities and technical teachers, adjusted for cost of living (2025)

Teacher median annual salaries, by grade level and by state (2025)
| 1. | Alaska | $77,000 |
| 2. | Massachusetts | $72,900 |
| 3. | Colorado | $66,900 |
| 4. | New Jersey | $65,800 |
| 5. | Washington state | $65,100 |
| 6. | Virginia | $64,300 |
| 7. | New Mexico | $63,600 |
| 8. | New York | $63,100 |
| 9. | Maryland | $63,000 |
| 10. | Georgia | $62,700 |
Teacher median annual salaries, by grade level and by state, adjusted for cost of living (2025)
| 1. | Alaska | $75,300 |
| 2. | Massachusetts | $70,900 |
| 3. | Colorado | $67,200 |
| 4. | Nebraska | $65,800 |
| 5. | New Mexico | $64,500 |
| 6. | Georgia | $64,400 |
| 7. | Virginia | $64,200 |
| 8. | New Jersey | $63,500 |
| 9. | Texas | $63,500 |
| 10. | Washington state | $62,600 |
How does the government help low-income students?
Keep exploring

Methodology
USAFacts standardizes data, in areas such as time and demographics, to make it easier to understand and compare.
Page sources
USAFacts endeavors to share the most up-to-date information available. We sourced the data on this page directly from government agencies; however, the intervals at which agencies publish updated data vary.

