How much do households in the Detroit, MI area spend on rent?
Refreshed annually
About $1,207, or 32.3% of their income, in 2020–2024. This is measured by comparing median, or average, rent and median monthly income for renting households.
$1.21K
median monthly rent in Detroit, MI area (2020–2024)
32.3%
average share of income spent on rent in Detroit, MI area (2020–2024)
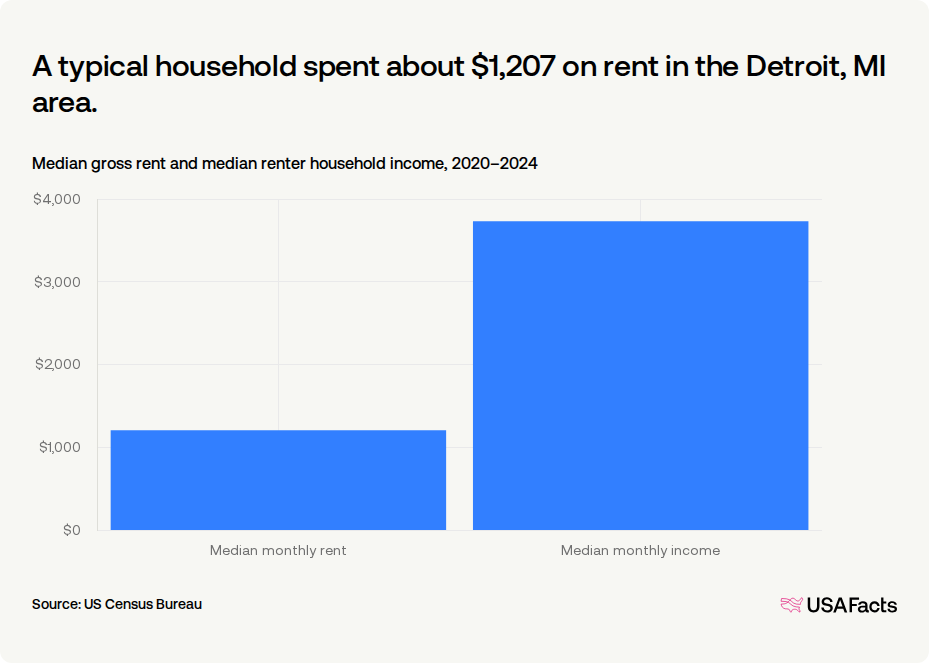
Comparing rent to renter income provides one measure of rental affordability. The Detroit, MI area (Detroit-Warren-Dearborn, MI Metro Area)’s median rent was about $1,207 per month in 2020–2024. Typical monthly income among renting households was about $3,733 per month during that same period.
A typical household spent about $1,207 on rent in the Detroit, MI area.
Median gross rent and median renter household income, 2020–2024
Dividing rent by income provides what is called a rent-to-income ratio. A higher ratio of rent-to-income indicates rent is less affordable while a lower ratio indicates greater affordability.
The Department of Housing and Urban Development considers households with a rent-to-income ratio of more than 30%, that is, households that spend more than 30% their income on housing, to be cost-burdened. Cost-burdened households may have less money for other necessities such as food, healthcare, or savings. When median monthly rent is more than 30% of median monthly income, it means a typical household would meet the definition of housing cost-burdened.
Get weekly insights
Subscribe for data-driven insights. No spin, just the facts.
Do households in the Detroit, MI area spend more or less on rent than other Michigan metros?
The Detroit, MI area’s rent-to-income ratio ranked 4 out of 16 Michigan metros.
Ratio of median gross rent to median renter household income, 2020–2024
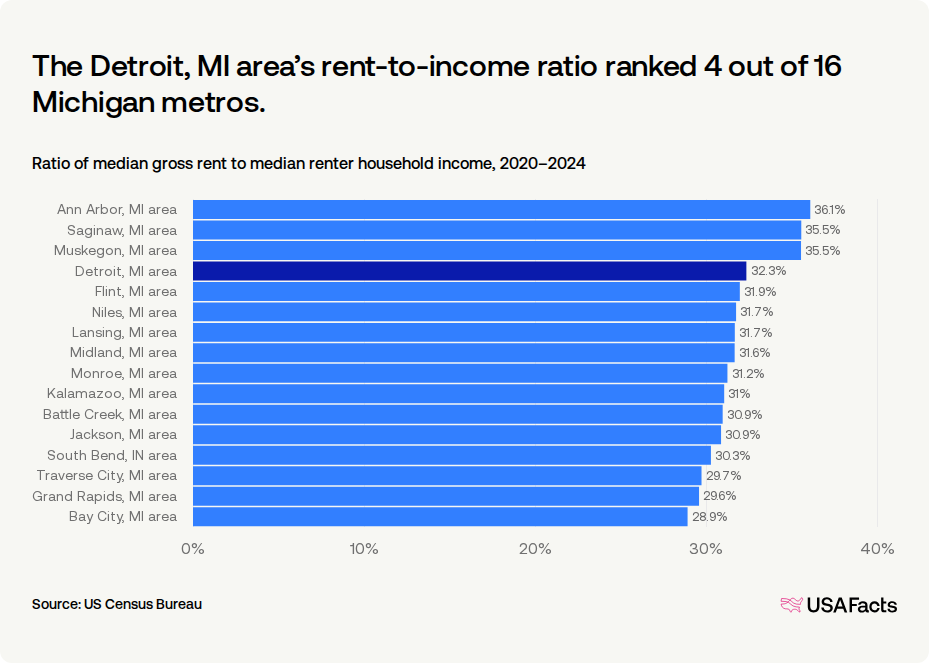
Compared to other metro areas in the state, the Detroit, MI area had the third highest median rent and fourth highest median renter-household income. (Metro areas are made up of economically interconnected counties that include at least one urban area. A single metro area can include multiple cities and cross state lines.) Out of the 16 metros in the state, the Detroit, MI area’s rent-to-income ratio ranked fourth highest.
Do households in the Detroit, MI area spend more or less on rent than other large metros?
The large metro median rent-to-income ratio was 31.9%.
Ratio of median gross rent to median renter household income, 2020–2024
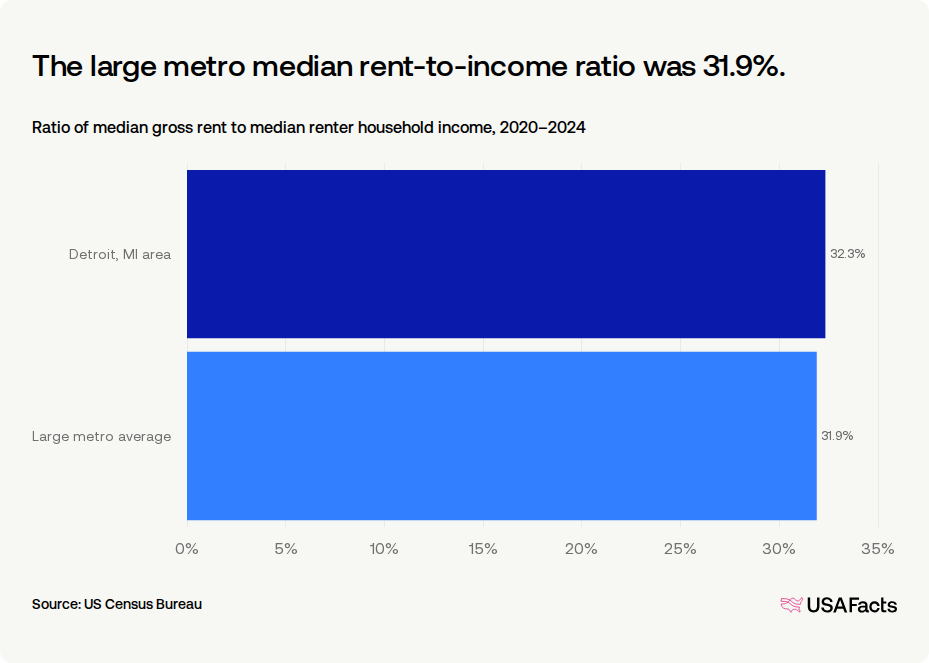
The Detroit, MI area is a large metro, which has over 1 million people. Compared to other large metros, the Detroit, MI area’s rent-to income ratio is similar to the average.
Renter income and rent, large metro areas (2020–2024)
| 1. | $10,148 | |
| 2. | $7,944 | |
| 3. | $6,827 | |
| 4. | $6,551 | |
| 5. | $6,501 | |
| 6. | $5,887 | |
| 7. | $5,874 | |
| 8. | $5,869 | |
| 9. | $5,709 | |
| 10. | $5,470 |
Keep exploring
Methodology
USAFacts standardizes data, in areas such as time and demographics, to make it easier to understand and compare.
Page sources
USAFacts endeavors to share the most up-to-date information available. We sourced the data on this page directly from government agencies; however, the intervals at which agencies publish updated data vary.
