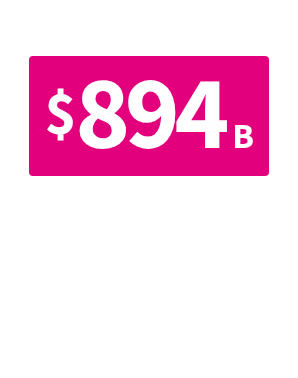
How many people are on Medicaid in the US?
88.2M
26%
In FY 2024, 26% of people were covered by Medicaid.
Average monthly Medicaid enrollment as a share of the population, FY 1974 – 2024
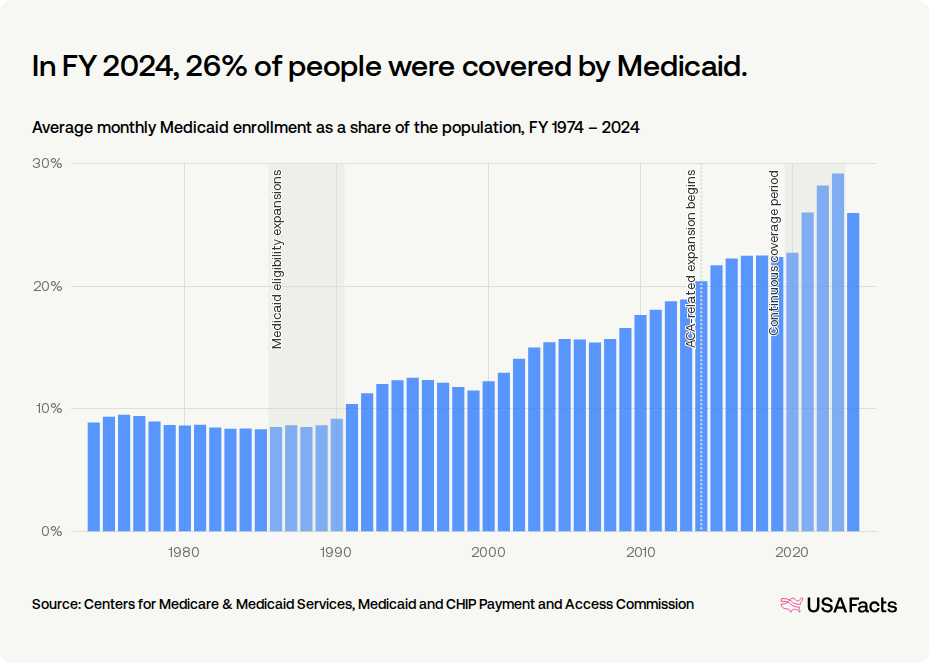
How has Medicaid enrollment changed over time?
Get weekly insights
Subscribe for data-driven insights. No spin, just the facts.
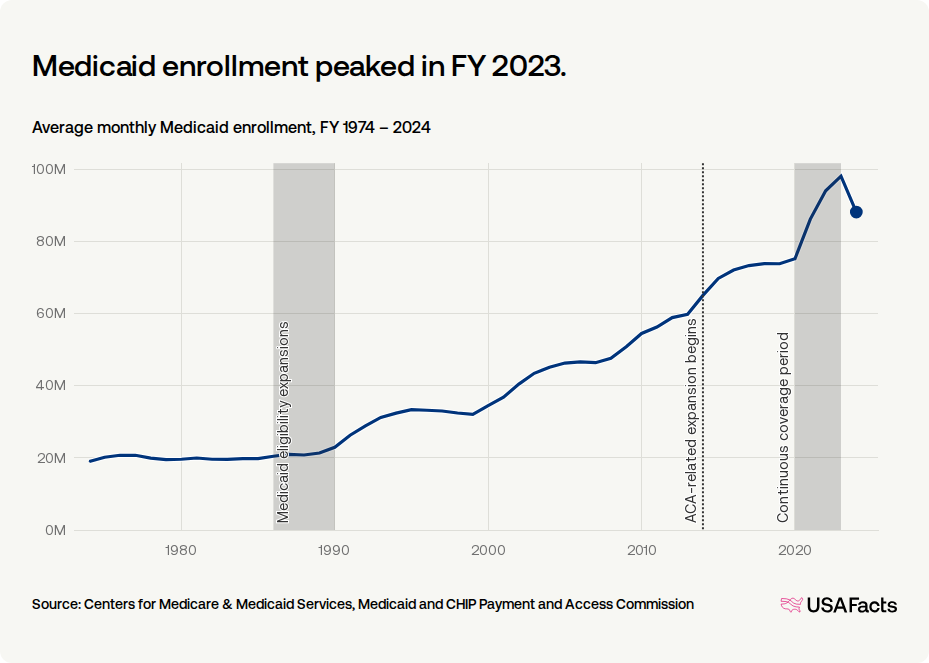
Medicaid enrollment peaked in FY 2023.
Average monthly Medicaid enrollment, FY 1974 – 2024
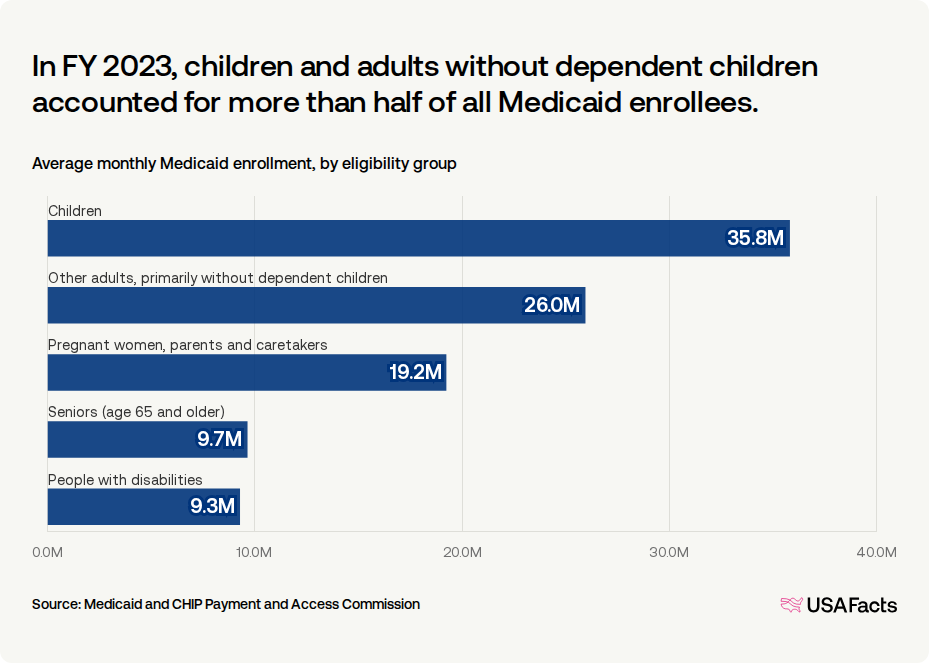
How does Medicaid categorize enrollees?
In FY 2023, children and adults without dependent children accounted for more than half of all Medicaid enrollees.
Average monthly Medicaid enrollment, by eligibility group
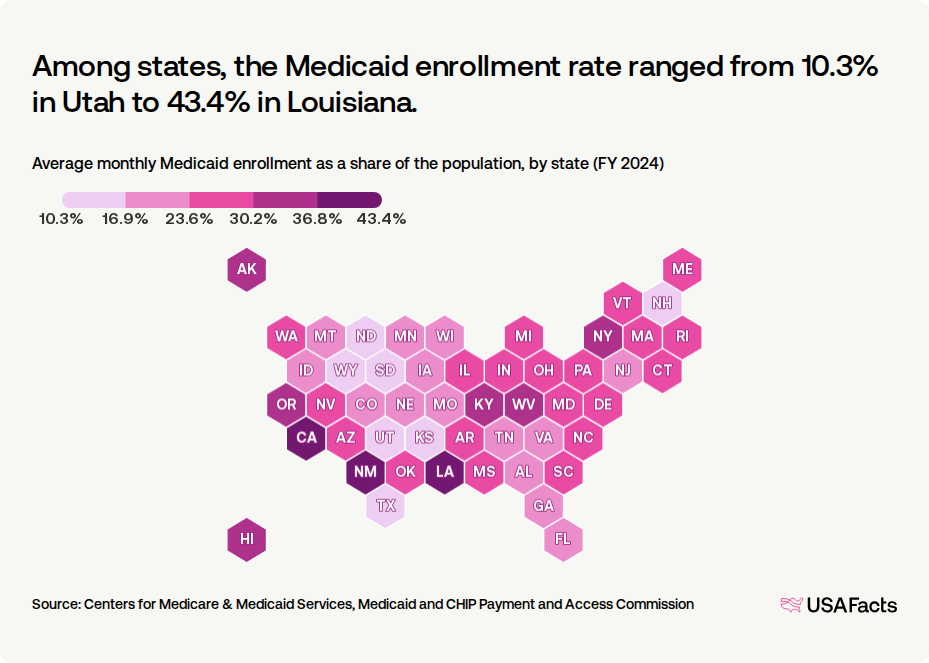
Which state has the largest share of people on Medicaid? Which has the lowest?
Among states, the Medicaid enrollment rate ranged from 10.3% in Utah to 43.4% in Louisiana.
Average monthly Medicaid enrollment as a share of the population, by state (FY 2024)
Average monthly Medicaid enrollment as a share of the population, by state (FY 2024)
| State | Share of population | |
|---|---|---|
| 1. | Louisiana | 43.4% |
| 2. | New Mexico | 41.8% |
| 3. | Washington, DC | 39.5% |
| 4. | California | 37.6% |
| 5. | New York | 36.2% |
| 6. | Alaska | 33.2% |
| 7. | Hawaii | 32.2% |
| 8. | Kentucky | 31.5% |
| 9. | Oregon | 30.4% |
| 10. | West Virginia | 30.3% |
Steve Ballmer explains Medicaid in under eight minutes
Keep exploring
Methodology
USAFacts standardizes data, in areas such as time and demographics, to make it easier to understand and compare.
Page sources
USAFacts endeavors to share the most up-to-date information available. We sourced the data on this page directly from government agencies; however, the intervals at which agencies publish updated data vary.

