How many people are on Medicaid in Maryland?
Updated annually
On average 1.5M or 24% of Maryland's population during 2024. With about 1 in 4 people enrolled in the program, Medicaid is one of the largest health insurers in Maryland.
1.5M
enrolled in Medicaid (FY 2024)
24%
of the Maryland population enrolled in Medicaid (FY 2024)
As of 2024, Maryland had a lower Medicaid enrollment rate than the US overall. Enrollment in the state peaked in 2022 at 29.9%.
In 2024, 24% of Maryland residents were covered by Medicaid.
Average monthly Medicaid enrollment as a share of the population
In 2024, 1.5 million people in Maryland were covered by Medicaid, down 19.1% from its FY 2022 peak.
In addition to economic conditions, Medicaid enrollment has been affected by changes in policy. For example, during the pandemic, the federal government provided states with additional Medicaid funding on the condition that they not disenroll anyone from Medicaid. This was in effect between 2020 and 2023.
Medicaid enrollment peaked in FY 2022.
Average monthly Medicaid enrollment
Eligibility in Medicaid is determined by a combination of federal guidelines and state-level rules, primarily based on income, household size, disability status, age, and other factors such as pregnancy or caretaking responsibilities.
As a part of the Affordable Care Act, states have had the option to extend eligibility to a larger subset of adults than previously possible. Maryland expanded Medicaid in January 2014.
In Maryland, enrollees are categorized into 5 different categories:
Children Seniors (age 65 and over) People with disabilities (including both adults and children) Pregnant women and parents or caretakers Adults without dependent children
In FY 2022, the latest data available, children were the largest category in Maryland, accounting for 32.4% of all enrollees. For comparison, children accounted for 35.8% of all enrollees nationwide.
In FY 2022, children were the largest category of Medicaid enrollees in Maryland.
Average monthly Medicaid enrollment, by eligibility group
Medicaid in the states
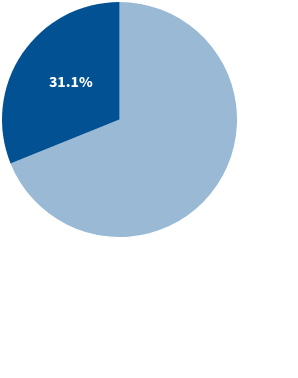
In 2023, states paid an average of 31.1% of the overall spending on Medicaid.
Source: Medicaid and CHIP Payment and Access Commission

Keep exploring
Methodology
USAFacts standardizes data, in areas such as time and demographics, to make it easier to understand and compare.
The analysis was generated with the help of AI and reviewed by USAFacts for accuracy.
Page sources
USAFacts endeavors to share the most up-to-date information available. We sourced the data on this page directly from government agencies; however, the intervals at which agencies publish updated data vary.

