How many people are laid off in the US each month?
1.87M
5.24M
Layoffs were 0.79% higher by March 2026 than by March 2025.
Cumulative monthly layoffs and discharges, seasonally adjusted

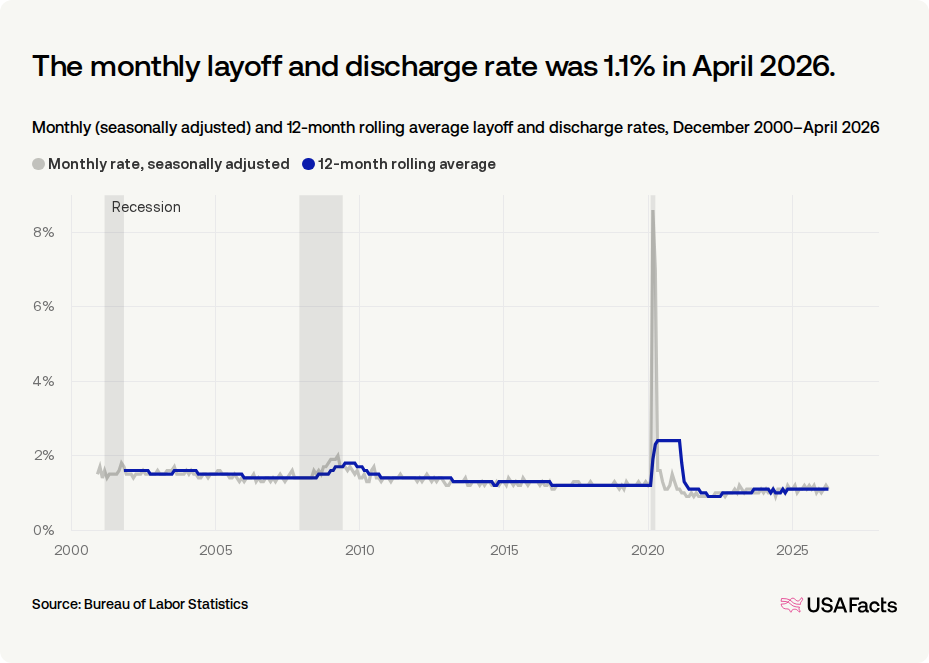
What is the layoff and discharge rate?
The monthly layoff and discharge rate was 1.2% in March 2026.
Monthly (seasonally adjusted) and 12-month rolling average layoff and discharge rates, December 2000–March 2026
What industries have the highest and lowest layoff rates?
The layoff and discharge rate was highest in the information and professional services industry in March 2026.
March 2026 (seasonally adjusted) and March 2023–February 2026 average average layoff and discharge rates, by industry

What states have the highest and lowest layoff rates?
The December 2025 layoff and discharge rate was highest in Idaho.
Seasonally adjusted layoff and discharge rate, December 2025
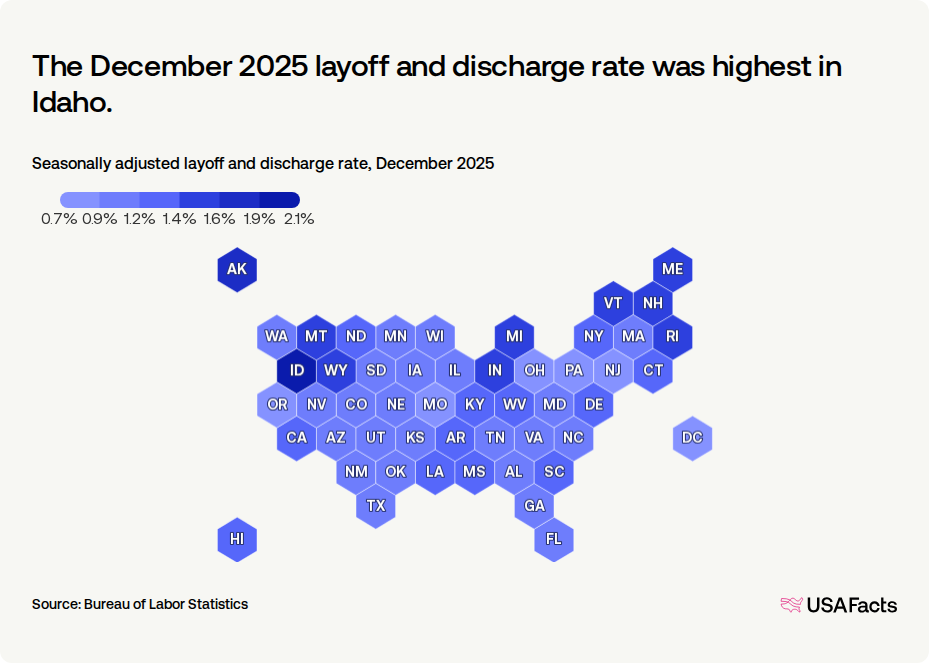
Layoff and discharge rate, by state (December 2025)
| 1. | Idaho | 2.1% |
| 2. | Alaska | 1.8% |
| 3. | Indiana | 1.6% |
| 4. | New Hampshire | 1.6% |
| 5. | Vermont | 1.6% |
| 6. | Montana | 1.5% |
| 7. | Maine | 1.4% |
| 8. | Michigan | 1.4% |
| 9. | Rhode Island | 1.4% |
| 10. | Wyoming | 1.4% |
Keep exploring
Methodology
USAFacts standardizes data, in areas such as time and demographics, to make it easier to understand and compare.
The analysis was generated with the help of AI and reviewed by USAFacts for accuracy.
Page sources
USAFacts endeavors to share the most up-to-date information available. We sourced the data on this page directly from government agencies; however, the intervals at which agencies publish updated data vary.
