How many illegal crossings are attempted at the US-Mexico border each month?
Refreshed monthly
About 10K attempted crossings were detected in May 2026, 14.6% more than May 2025. These attempted crossings, sometimes referred to as “encounters,” are instances when the US Border Patrol (USBP) apprehended or expelled someone attempting to illegally cross into the US between official ports of entry. This number does not necessarily represent individual people, as one person may be counted several times if they make multiple attempts to cross the border.
According to the Department of Homeland Security, USBP intercepted an estimated 80% of attempted border crossings along the US-Mexico border in 2021, the most recent data available.
10K
illegal border crossings detected at the US-Mexico border (May 2026)
14.6%
more illegal border crossings detected (May 2026 vs. May 2025)
Detected crossing attempts decreased at the onset of the COVID-19 pandemic in early 2020. Encounter levels during this time were similar to the lows reported between 2010 and 2015.
Around September 2020, the number of detected crossings began to increase and remained high along the southwest US border. During this time and into 2021, the recidivism rate — the likelihood that an individual attempted to cross into the US more than once in a single year — nearly quadrupled compared to pre-pandemic levels. A 2023 Congressional Research Service report attributed this primarily to Title 42, a policy active from March 2020 to May 2023, which made it easier for the government to expel migrants at the border, but did not penalize repeated crossing attempts.
Get weekly insights
Subscribe for data-driven insights. No spin, just the facts.
The total number of detected crossings, which do not differentiate between a new and repeat crossing, continued to rise from 2020 through 2023. They peaked in December 2023 at 249,700 before decreasing throughout 2024.
Attempted illegal border crossings increased to record high during the COVID-19 pandemic.
Detected monthly crossings between official ports of entry along the US-Mexico border, Sep 2000 – May 2026

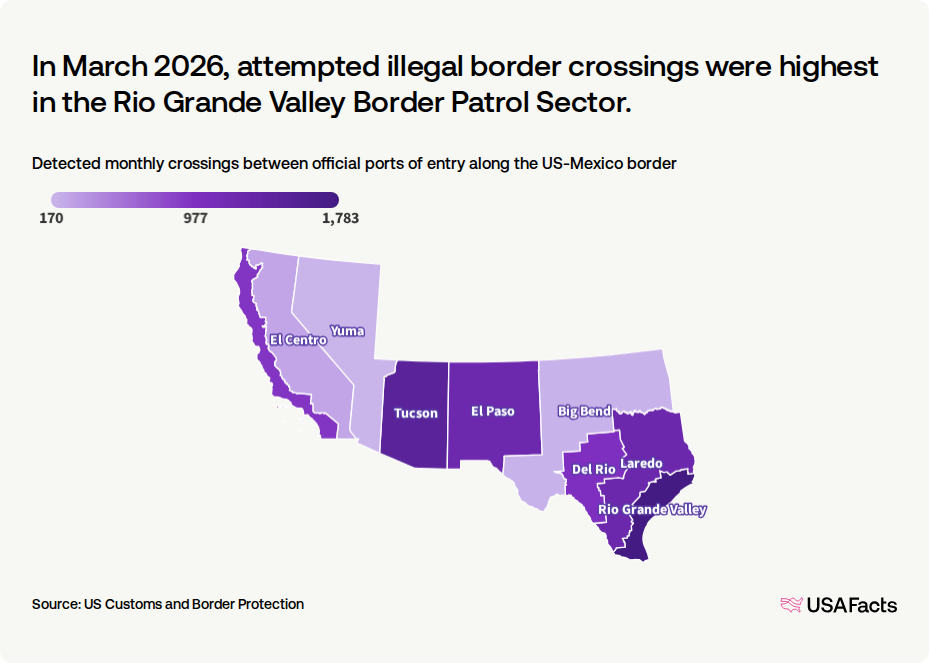
Which region has the most illegal border crossings?
The US-Mexico border is nearly 2,000 miles long and spans five states. Attempted border crossings are detected at different rates along the entire border. The USBP divides this area into nine regions, each managed as a single border patrol sector.In May 2026, attempted illegal border crossings were highest in the Rio Grande Valley Border Patrol Sector.
Detected monthly crossings between official ports of entry along the US-Mexico border
How have illegal border crossings changed in the last year?
In May 2026, the number of detected crossing attempts increased in six sectors and decreased in three sectors compared to 12 months earlier. The increase was largest in the Yuma sector, where crossings increased by 78.5% between May 2025 and May 2026. These changes may reflect fluctuating migration routes or policy shifts.Attempted illegal border crossings increased the most in the Yuma border patrol sector.
Detected monthly crossings between official ports of entry along the US-Mexico border

Steve Ballmer explains the US immigration system in under 15 minutes
Keep exploring
Methodology
USAFacts standardizes data, in areas such as time and demographics, to make it easier to understand and compare.
Page sources
USAFacts endeavors to share the most up-to-date information available. We sourced the data on this page directly from government agencies; however, the intervals at which agencies publish updated data vary.
