How many jobs were lost in Washington, DC last month?
Refreshed monthly
Washington, DC lost 1,200 jobs in August 2026. Those figures come from the Bureau of Labor Statistics' state employment report, which tracks monthly job changes. Job numbers can swing month to month as local economies expand or contract, but over the past five years the state has averaged about 330 new jobs per month. These figures are often revised in later months as more complete data rolls in.
-1.2K
month to month change in number of jobs (August 2026)
Washington, DC’s job loss of 1,200 in August 2026 was a directional change from the previous month. The latest monthly job change was down from the 400 gain in July 2026.
During the latest five year period (September 2021 to August 2026), Washington, DC gained jobs in 23 out of 60 months. August 2026 had the 19th-lowest job growth during this period. The highest gains during this period occurred in October 2021 (+8,300) while job growth was weakest in October 2025 (-17,600).
There were 1,200 fewer jobs in August 2026 in Washington, DC than the previous month.
Monthly change in nonfarm employment, September 2021–August 2026, seasonally adjusted

Which Washington, DC sectors and industries had the best and worst job growth in August 2026?
The supersector with the highest job growth in August 2026 was health care and social assistance. Health care and social assistance added 300 jobs, more than the entire economy. The remaining supersectors either posted job loss or no job change during the month.
The three lowest-performing supersectors were professional, scientific, and technical services, administrative and support and waste management and remediation services, and federal government. Professional, scientific, and technical services lost 700 jobs in August 2026, while administrative and support and waste management and remediation services lost 500 jobs and federal government lost 400 jobs.
Get weekly insights
Subscribe for data-driven insights. No spin, just the facts.
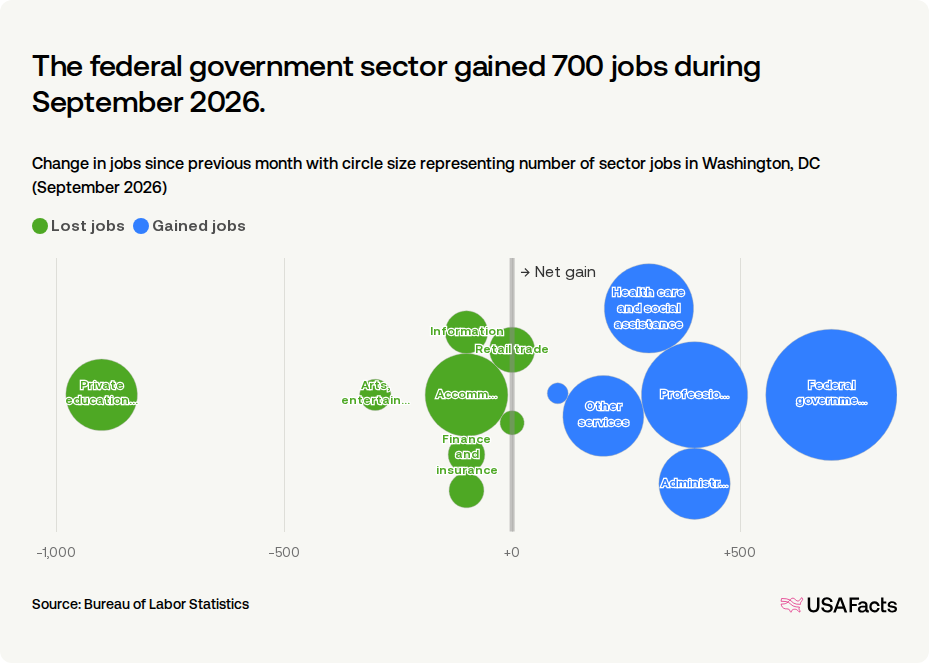
The federal government sector lost 400 jobs during August 2026.
Change in jobs since previous month with circle size representing number of sector jobs in Washington, DC (August 2026)
How has Washington, DC's job growth changed over time?
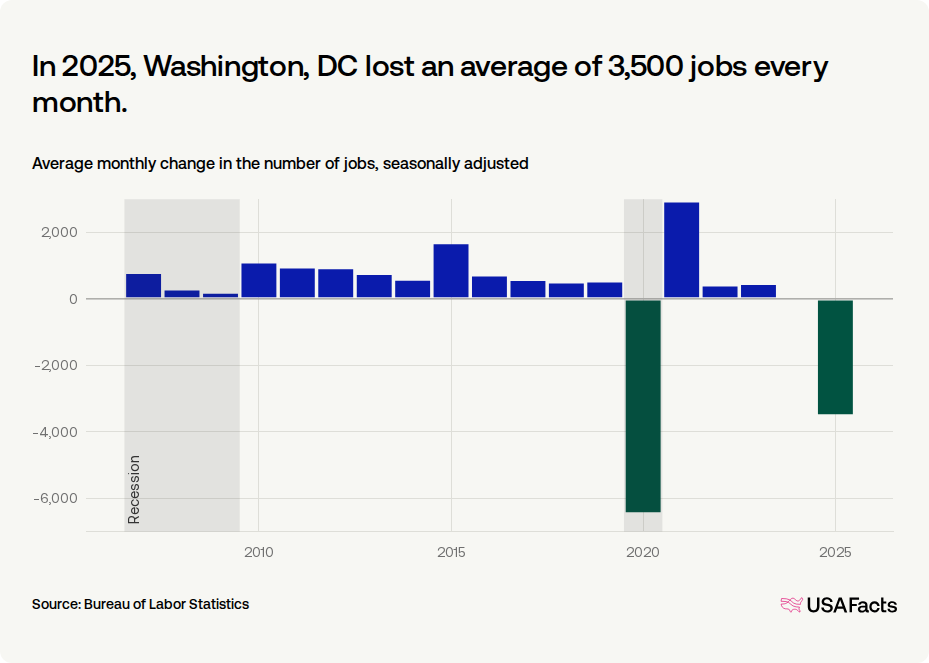
In 2025, Washington, DC lost an average of 3,467 jobs every month. That's lower than the 2024 average monthly increase of 0, and the lowest since 2020. The 2025 average ranks as second-lowest in job growth since 2007.
When excluding the two pandemic-affected years of 2020 and 2021, job growth ranged from a loss of 3,500 on average every month in 2025 to a gain of 1,600 on average every month in 2015.
In 2025, Washington, DC lost an average of 3,500 jobs every month.
Average monthly change in the number of jobs, seasonally adjusted
Monthly job growth, by metro area
Metro areas where at least one of its primary counties are within Washington, DC
| Metro area | Change in jobs | |
|---|---|---|
| 1. | -11,200 |
Keep exploring

Methodology
USAFacts standardizes data, in areas such as time and demographics, to make it easier to understand and compare.
Page sources
USAFacts endeavors to share the most up-to-date information available. We sourced the data on this page directly from government agencies; however, the intervals at which agencies publish updated data vary.
