In June 2026, about 57,000 jobs were gained. That's below the monthly average of 219,400 new jobs of the previous five years. This data comes from the Bureau of Labor Statistics' monthly Employment Situation Report, aka the “jobs report,” a closely watched economic indicators. These figures are often revised in later months as more complete data rolls in.
+57K
month to month change in number of jobs (June 2026)
+219K
average monthly change in number of jobs during the previous five years (July 2021–June 2026)
The monthly jobs number grabs attention but doesn’t tell the whole story; job growth might be strong overall yet uneven across industries or regions. The real changes show up in the detail.
Which parts of the economy had the best job growth in June 2026?
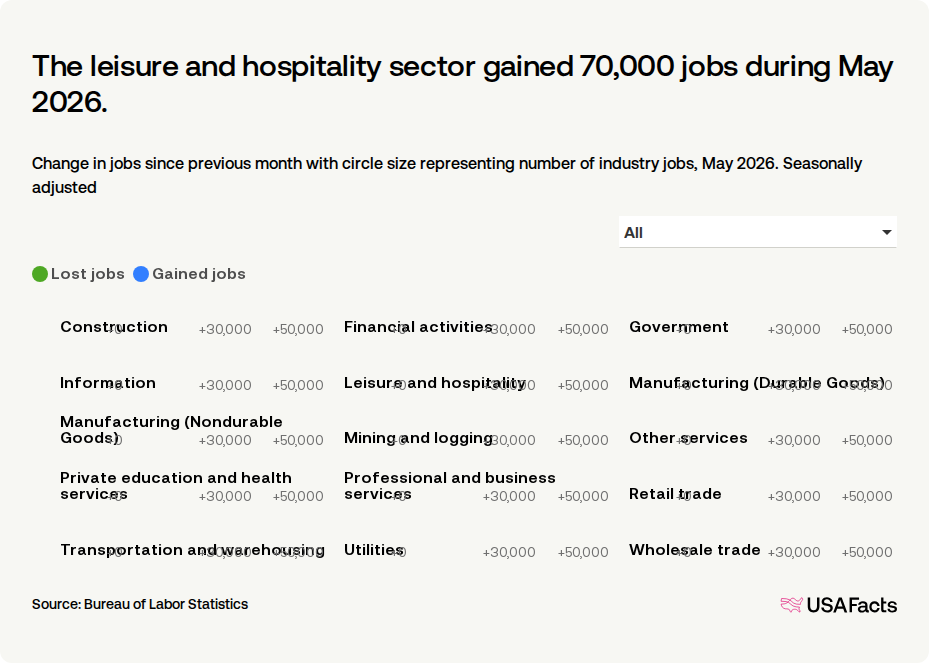
The three supersectors with the highest job growth in June 2026 were private education and health services, professional and business services, and construction. Private education and health services gained 69,000 jobs, while professional and business services added 36,000. The remaining supersectors either posted smaller gains or lost jobs during the month.
The three lowest-performing supersectors were leisure and hospitality, information, and retail trade. In June 2026, leisure and hospitality lost 61,000 jobs, more than the entire economy, while information lost 9,000 jobs and retail trade lost 8,000 jobs.
The private education and health services sector gained 69,000 jobs during June 2026.
Change in jobs since previous month with circle size representing number of industry jobs, June 2026. Seasonally adjusted
Which states had the best and worst job growth in May 2026?
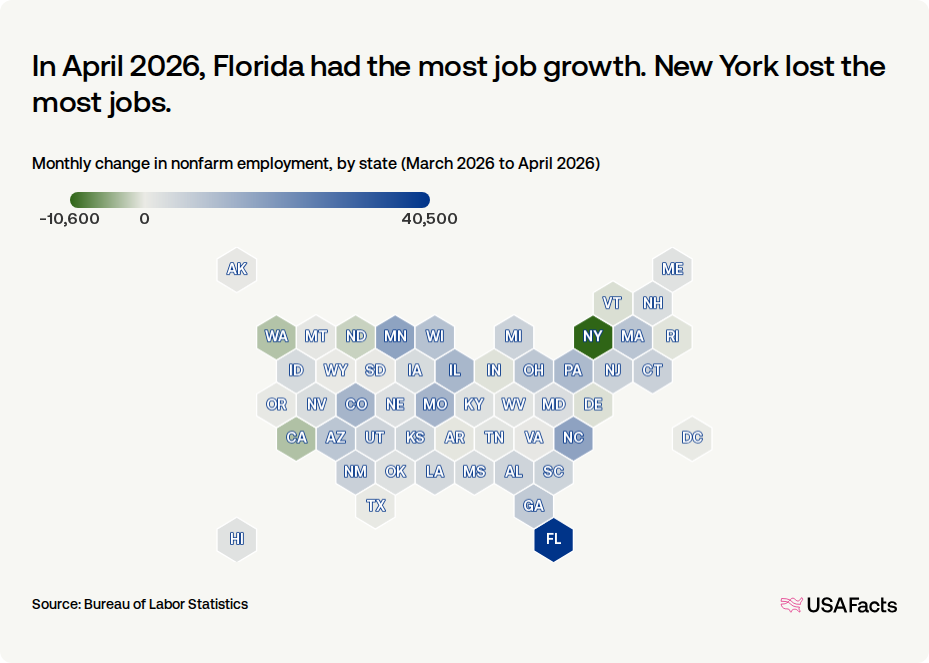
Texas led all states, gaining 17,800 in May 2026. Virginia had 8,000 fewer jobs, the largest decline of any state.
38 states experienced job growth in May 2026.
In May 2026, Texas had the most job growth. Virginia lost the most jobs.
Monthly change in nonfarm employment, by state (April 2026 to May 2026)
Among 393 metro areas — urban groupings geographically and economically integrated with one another — the New York, NY area gained the most jobs in May 2026 with an increase of 17,300. The Boston, MA area had the largest job loss at 4,100.
Get weekly insights
Subscribe for data-driven insights. No spin, just the facts.
How does job growth in June 2026 compare to recent months?
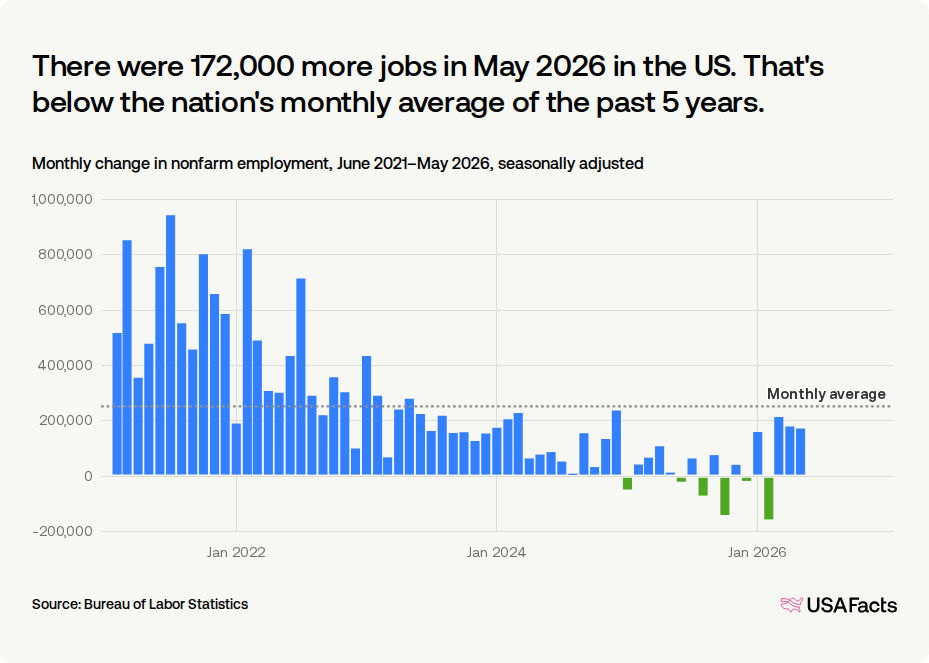
Job growth in June 2026 was below the average number of jobs gained in the last 5 years. Between July 2021 and June 2026 average monthly job gains were 219,400.
During the latest five-year period (July 2021 to June 2026), the US gained jobs in 54 out of 60 months. The most gains came in July 2021 (+942,000) while job growth was weakest in February 2026 (-156,000).
In 2020, at the start of the COVID-19 pandemic, monthly job changes ranged from 20.5 million lost in April to 4.6 million gained in June. Pre-pandemic, the single month of highest job growth was September 1983 (+1.1 million). The month with the worst loss was September 1945 (-2 million).
There were 57,000 more jobs in June 2026 in the US. That's below the nation's monthly average of the past 5 years.
Monthly change in nonfarm employment, July 2021–June 2026, seasonally adjusted
How does job growth in the past year compare to previous years?
Between July 2025 and June 2026 the US has gained an average of 42,200 jobs every month. That's lower than the increase of 65,300 per month in the July 2024 to June 2025.
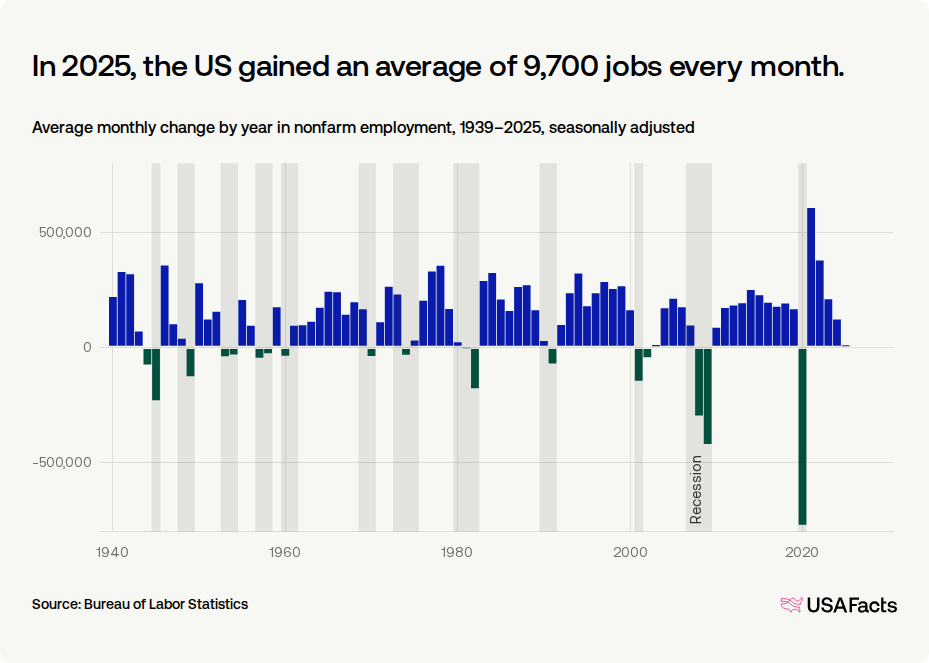
The monthly jobs report data goes back to 1939. The US usually added jobs each year, though the pace varies widely across economic cycles. Job growth slowed or turned negative during recessions (the early 1980s, the Great Recession, and the COVID-19 pandemic) then rebounded during the recoveries.
In 2025, the US gained an average of 9,700 jobs every month.
Average monthly change by year in nonfarm employment, 1939–2025, seasonally adjusted
USAFacts standardizes data, in areas such as time and demographics, to make it easier to understand and compare.
Page sources
USAFacts endeavors to share the most up-to-date information available. We sourced the data on this page directly from government agencies; however, the intervals at which agencies publish updated data vary.