How many job openings are there in the US?
Refreshed monthly
There were about 7.59 million job openings as of May 2026. The number of job openings increased by 284,000 from May 2025. A “job opening” is defined as a position open on the last business day of the month. To be considered “open,” a job must meet three conditions: (1) There’s work available for the position; (2) The job could start within 30 days; and (3) The employer is actively recruiting.
7.59M
job openings (May 2026)
284K
more unfilled jobs in May 2026 than in May 2025
The number of job openings is one measure of employer demand for workers and is a commonly referred-to economic indicator. An increase in the number of job openings often indicates the economy is growing, while a decline may indicate slowed growth.
The number of job openings increased over the last year.
Monthly job openings (seasonally adjusted), December 2000–May 2026

Monthly job openings trended upwards from a low of 2.2 million in July 2009, the end of the Great Recession, through a peak of 7.6 million in November 2018. In February 2020, one month before the declaration of the COVID-19 pandemic, there were 7.0 million job openings, which fell to 4.6 million in April. Job openings bounced back, hitting a record high of 12.3 million in March 2022 before again trending downwards. As of May 2026, job openings are up 3.9% from the year prior.
Get weekly insights
Subscribe for data-driven insights. No spin, just the facts.
What is the job openings rate?
The job openings rate is another way to consider this data. It tells us what percentage of all jobs, filled and unfilled, were open during a given time period. This allows for better comparisons across time, industries, and places by adjusting for differences in the size of the working population.
In May 2026, 4.6% of all jobs were unfilled, an increase of 0.32 percentage points from the average across the previous 12 months.
Layoffs
In May 2026, the layoff rate was highest in the construction industry.

What industry has the highest job openings rate?
In May 2026, the job openings rate was highest in the professional and business services industry.
May 2026 (seasonally adjusted) job openings rate and May 2025–April 2026 average job openings rate, by industry
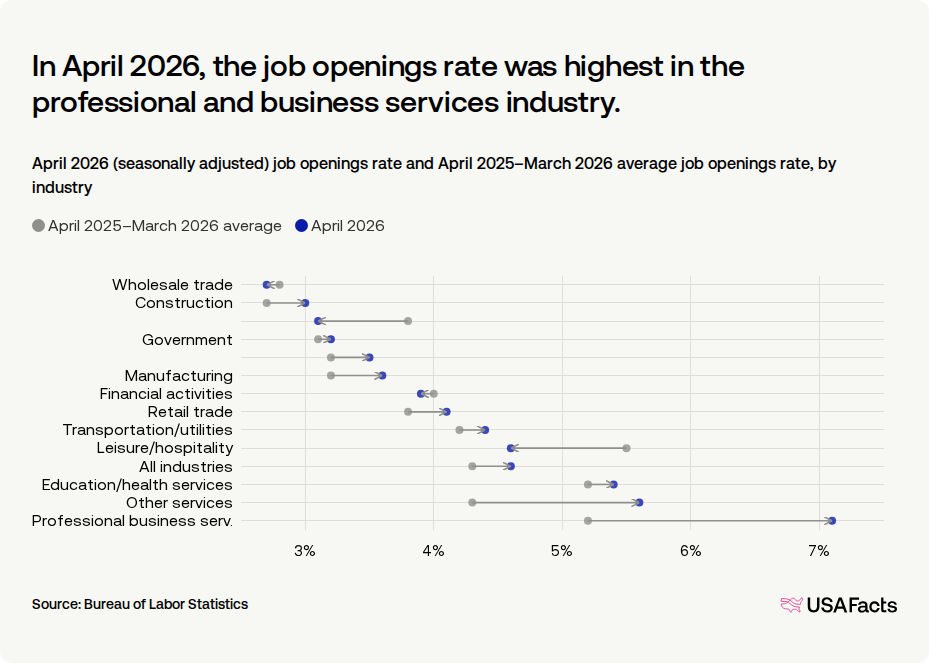
The job openings rate varies across industries, which experience different economic pressures. In May 2026, the rate was highest in the professional and business services (6.2%), leisure and hospitality (5.2%), and private education and health services (5.2%) industries. It was lowest in the information (2.6%) industry. Compared to the previous 12-month average, the job openings rate fell most in the information industry (-1.1 percentage points), and increased most in the wholesale trade industry (+1.3 percentage points).
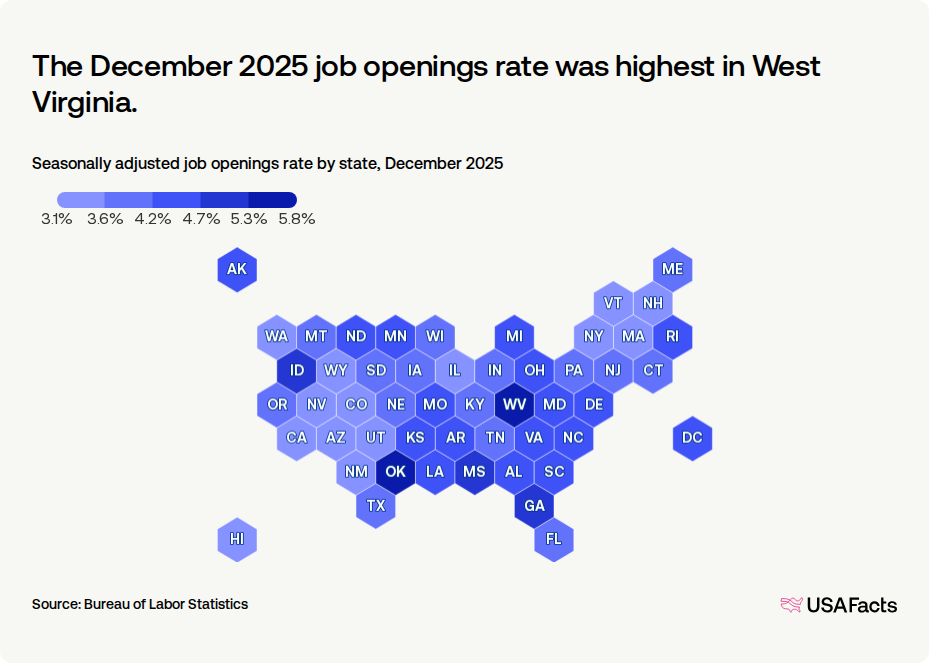
What states have the highest and lowest job openings rate?
Job openings rates also differ across states for a host of reasons, including the strength of the regional economy and the dominating industries. In December 2025, the rate ranged from a low of 3.1% in Hawaii to West Virginia's high of 5.8%.
Job openings data for states were released monthly through February 2026. At that time, BLS released December 2025 data and stated that state-level data would shift to annual release, to be published in July of each year.
The December 2025 job openings rate was highest in West Virginia.
Seasonally adjusted job openings rate by state, December 2025
Job openings rate, by state (December 2025)
| 1. | West Virginia | 5.8% |
| 2. | Oklahoma | 5.3% |
| 3. | Georgia | 5.2% |
| 4. | Idaho | 5% |
| 5. | Mississippi | 4.8% |
| 6. | Minnesota | 4.7% |
| 7. | Virginia | 4.7% |
| 8. | Ohio | 4.6% |
| 9. | Alaska | 4.5% |
| 10. | Arkansas | 4.5% |
Keep exploring
Methodology
USAFacts standardizes data, in areas such as time and demographics, to make it easier to understand and compare.
Page sources
USAFacts endeavors to share the most up-to-date information available. We sourced the data on this page directly from government agencies; however, the intervals at which agencies publish updated data vary.
