Economy
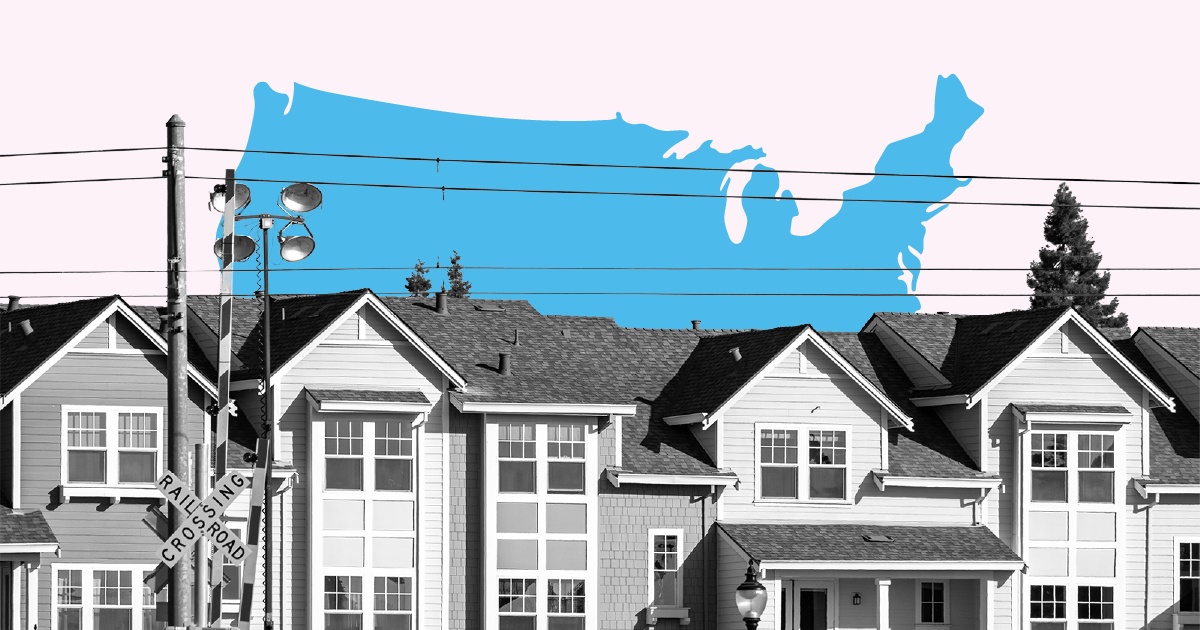
Who spends more of their income on housing in the US?

Standard of Living
Standard of Living
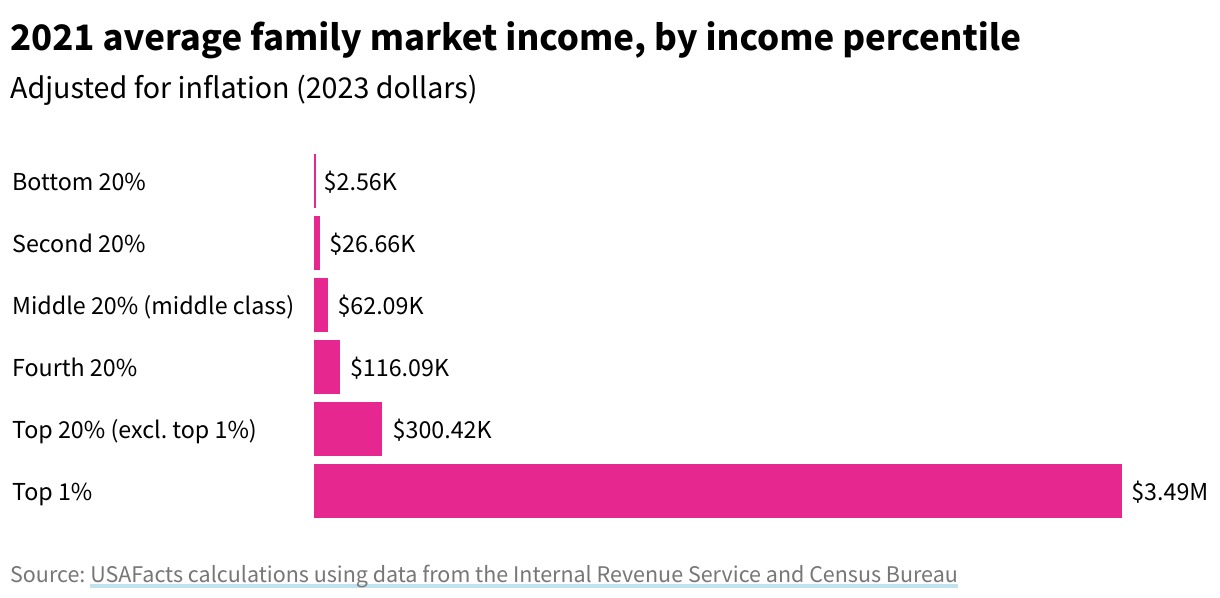
Adjusted for inflation, that’s $3,035 less than in 2000.
Standard of Living
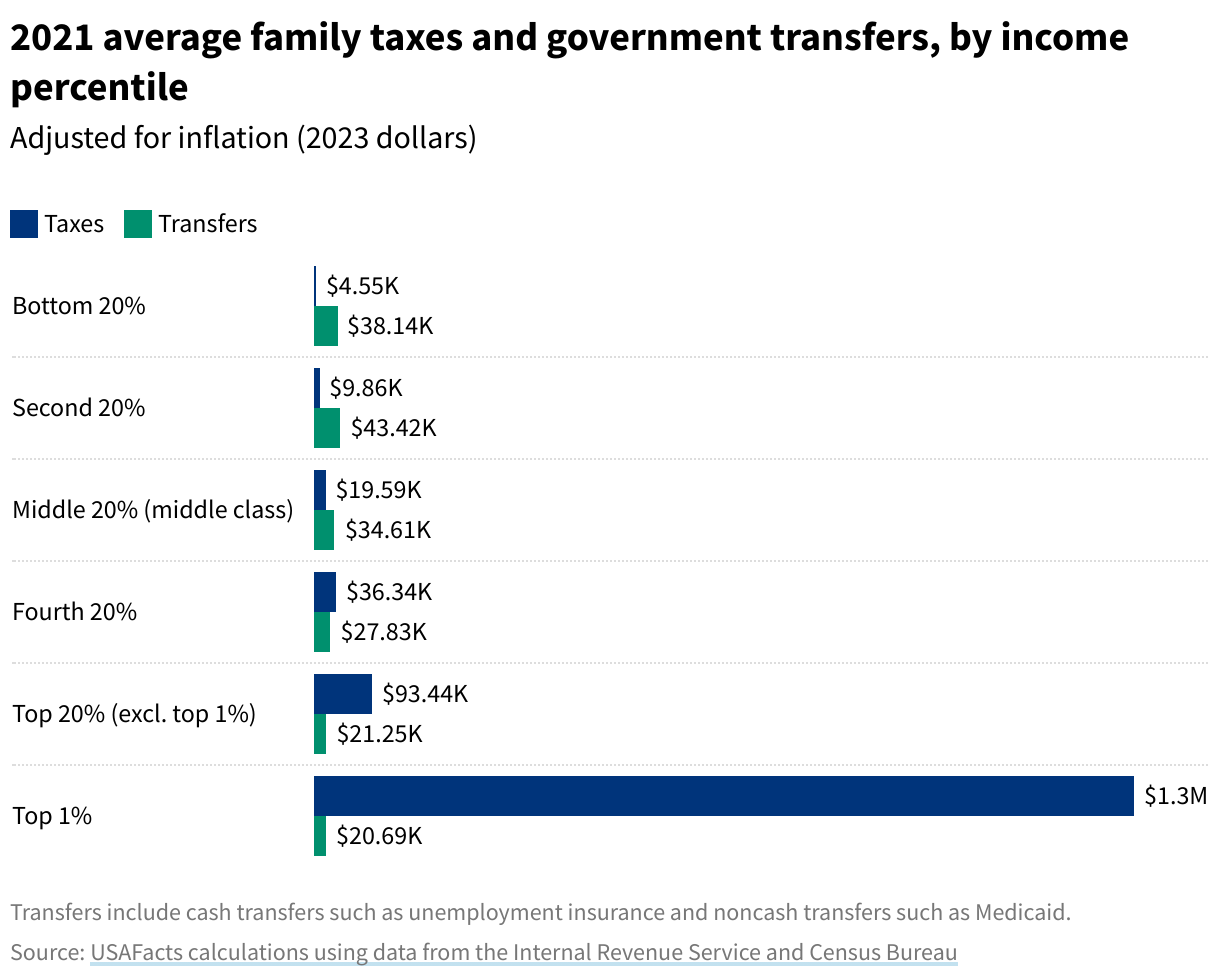
Compared to 2000, families received $19,834 more government assistance and paid $1,408 less taxes due to lower incomes, pandemic tax credits, and other changes to the tax code.
Standard of Living
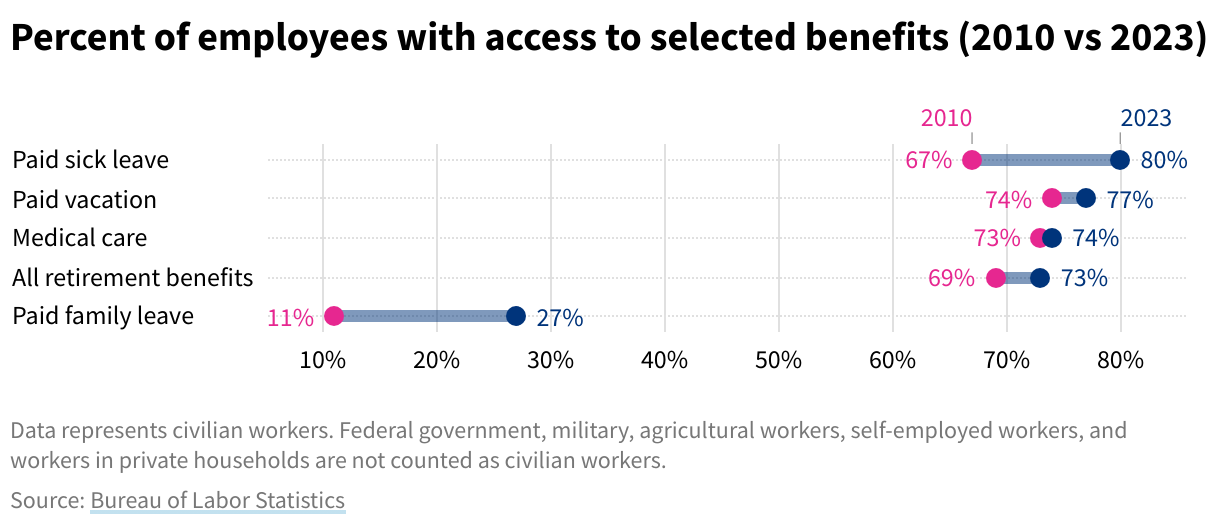
The percent of employees with access to paid family leave more than doubled from 11% in 2010 to 27% in 2023.
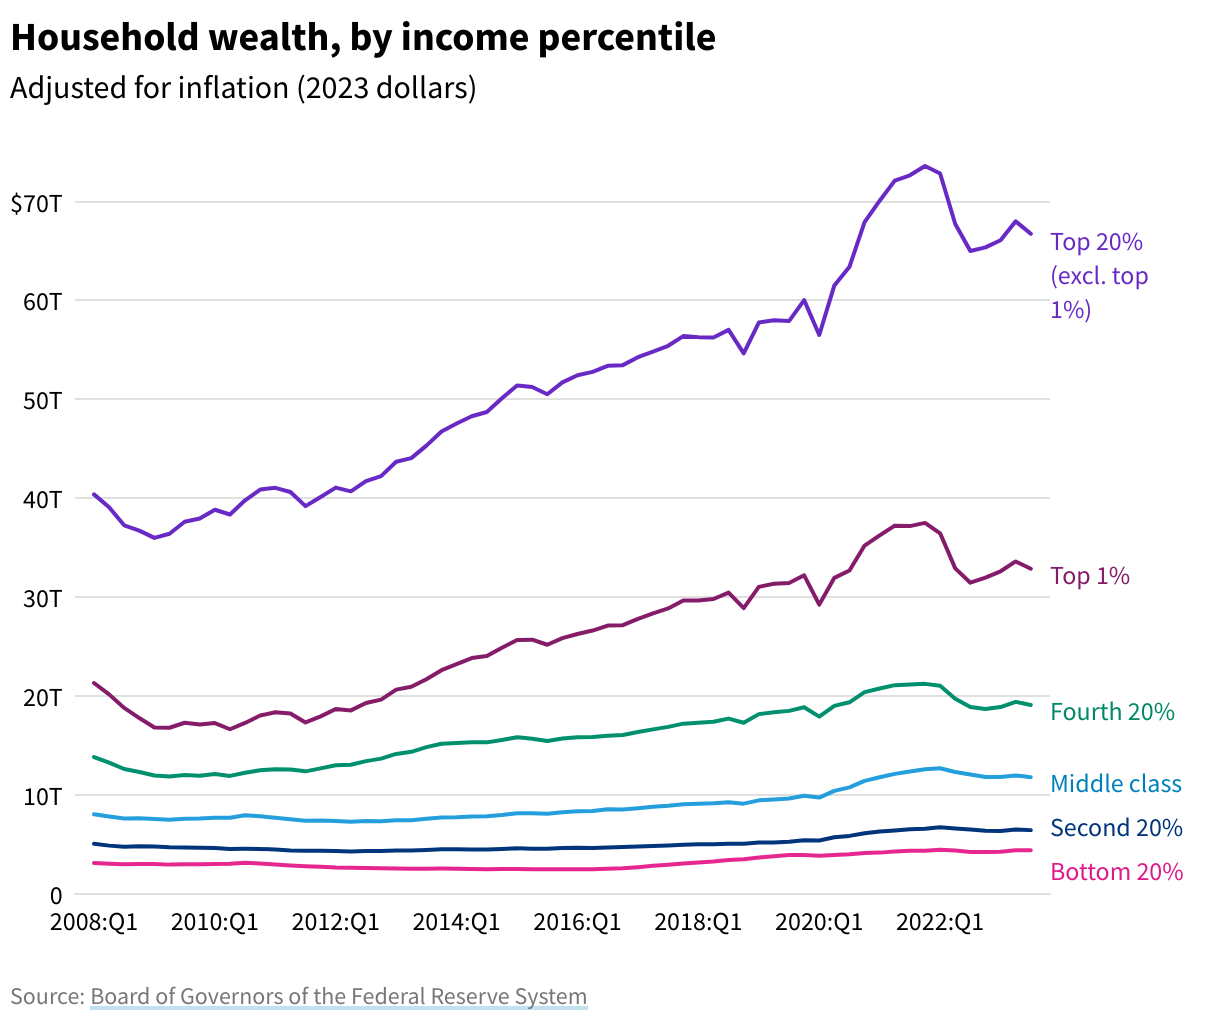
Standard of Living
This increase was partly due to all income quintiles gaining real estate wealth. Wealth in retirement accounts also decreased for all quintiles.
You are signed up for the facts!
Standard of Living
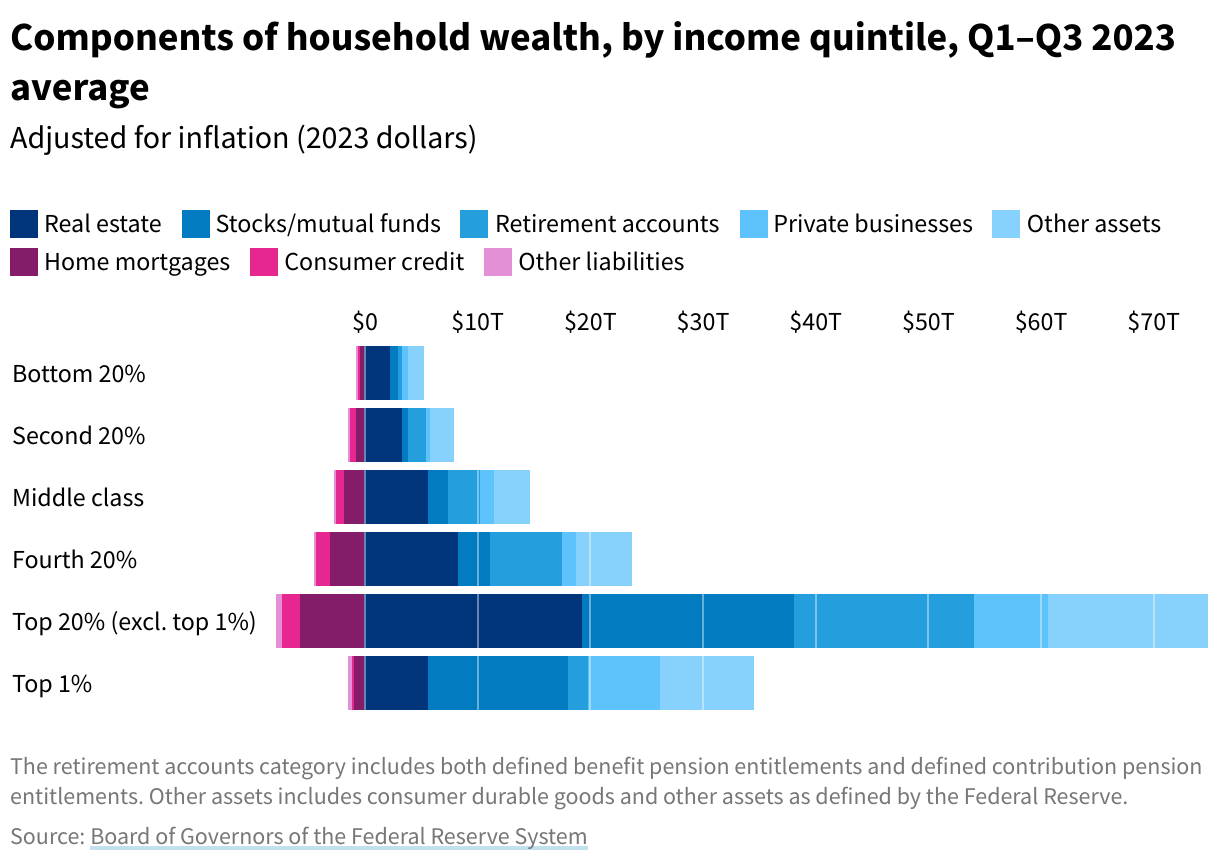
That’s 8.4% of total household wealth in the United States. Real estate is the largest component of middle-class wealth, while home mortgages are the largest liability. The top 20% has more wealth in real estate than the middle class has in total.
Standard of Living
Despite this rise, the poverty rate has been lower than its current rate in only five of the last 63 years. The poverty rate is consistently higher for children under 18 and Black and Hispanic groups than the nation overall.
Standard of Living
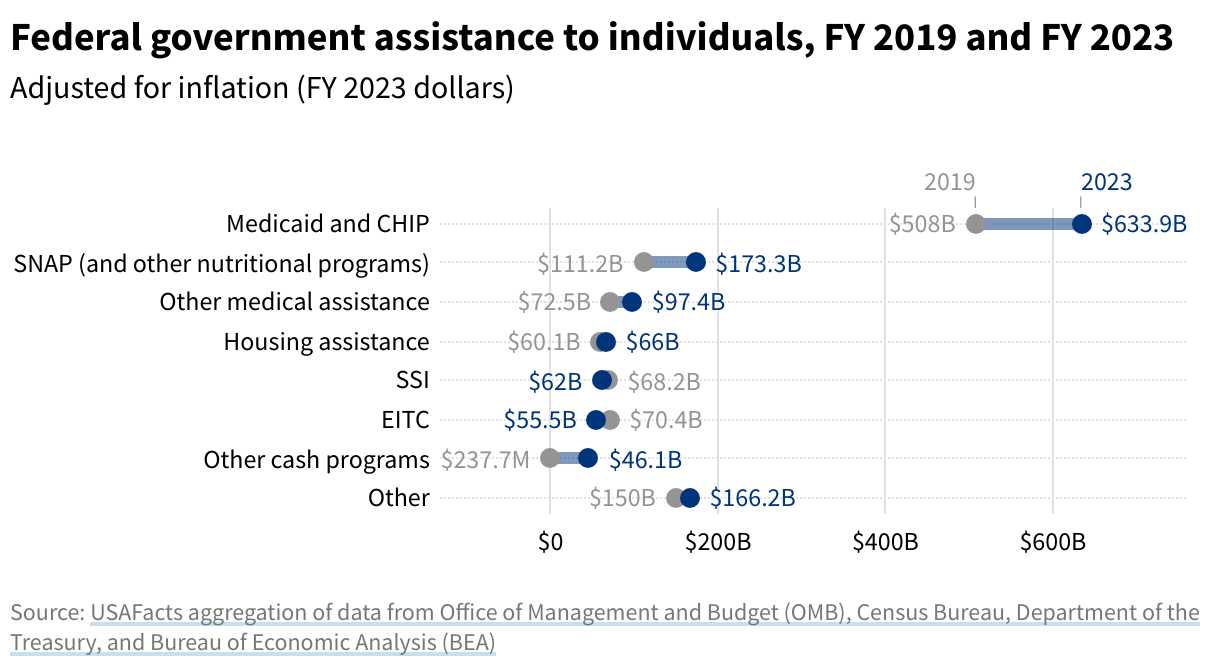
Medicaid and CHIP spending increased by over $125.8 billion from 2019 to 2023. The increase in other cash programs from $237.7 million to $46.1 billion was due to COVID payments and refundable tax credits.
Standard of Living
About 39%, or 256,610 homeless people, stayed in unsheltered locations in January 2023. Unsheltered locations include cars, tent encampments, abandoned buildings, and other places not intended for sleeping.