Economy
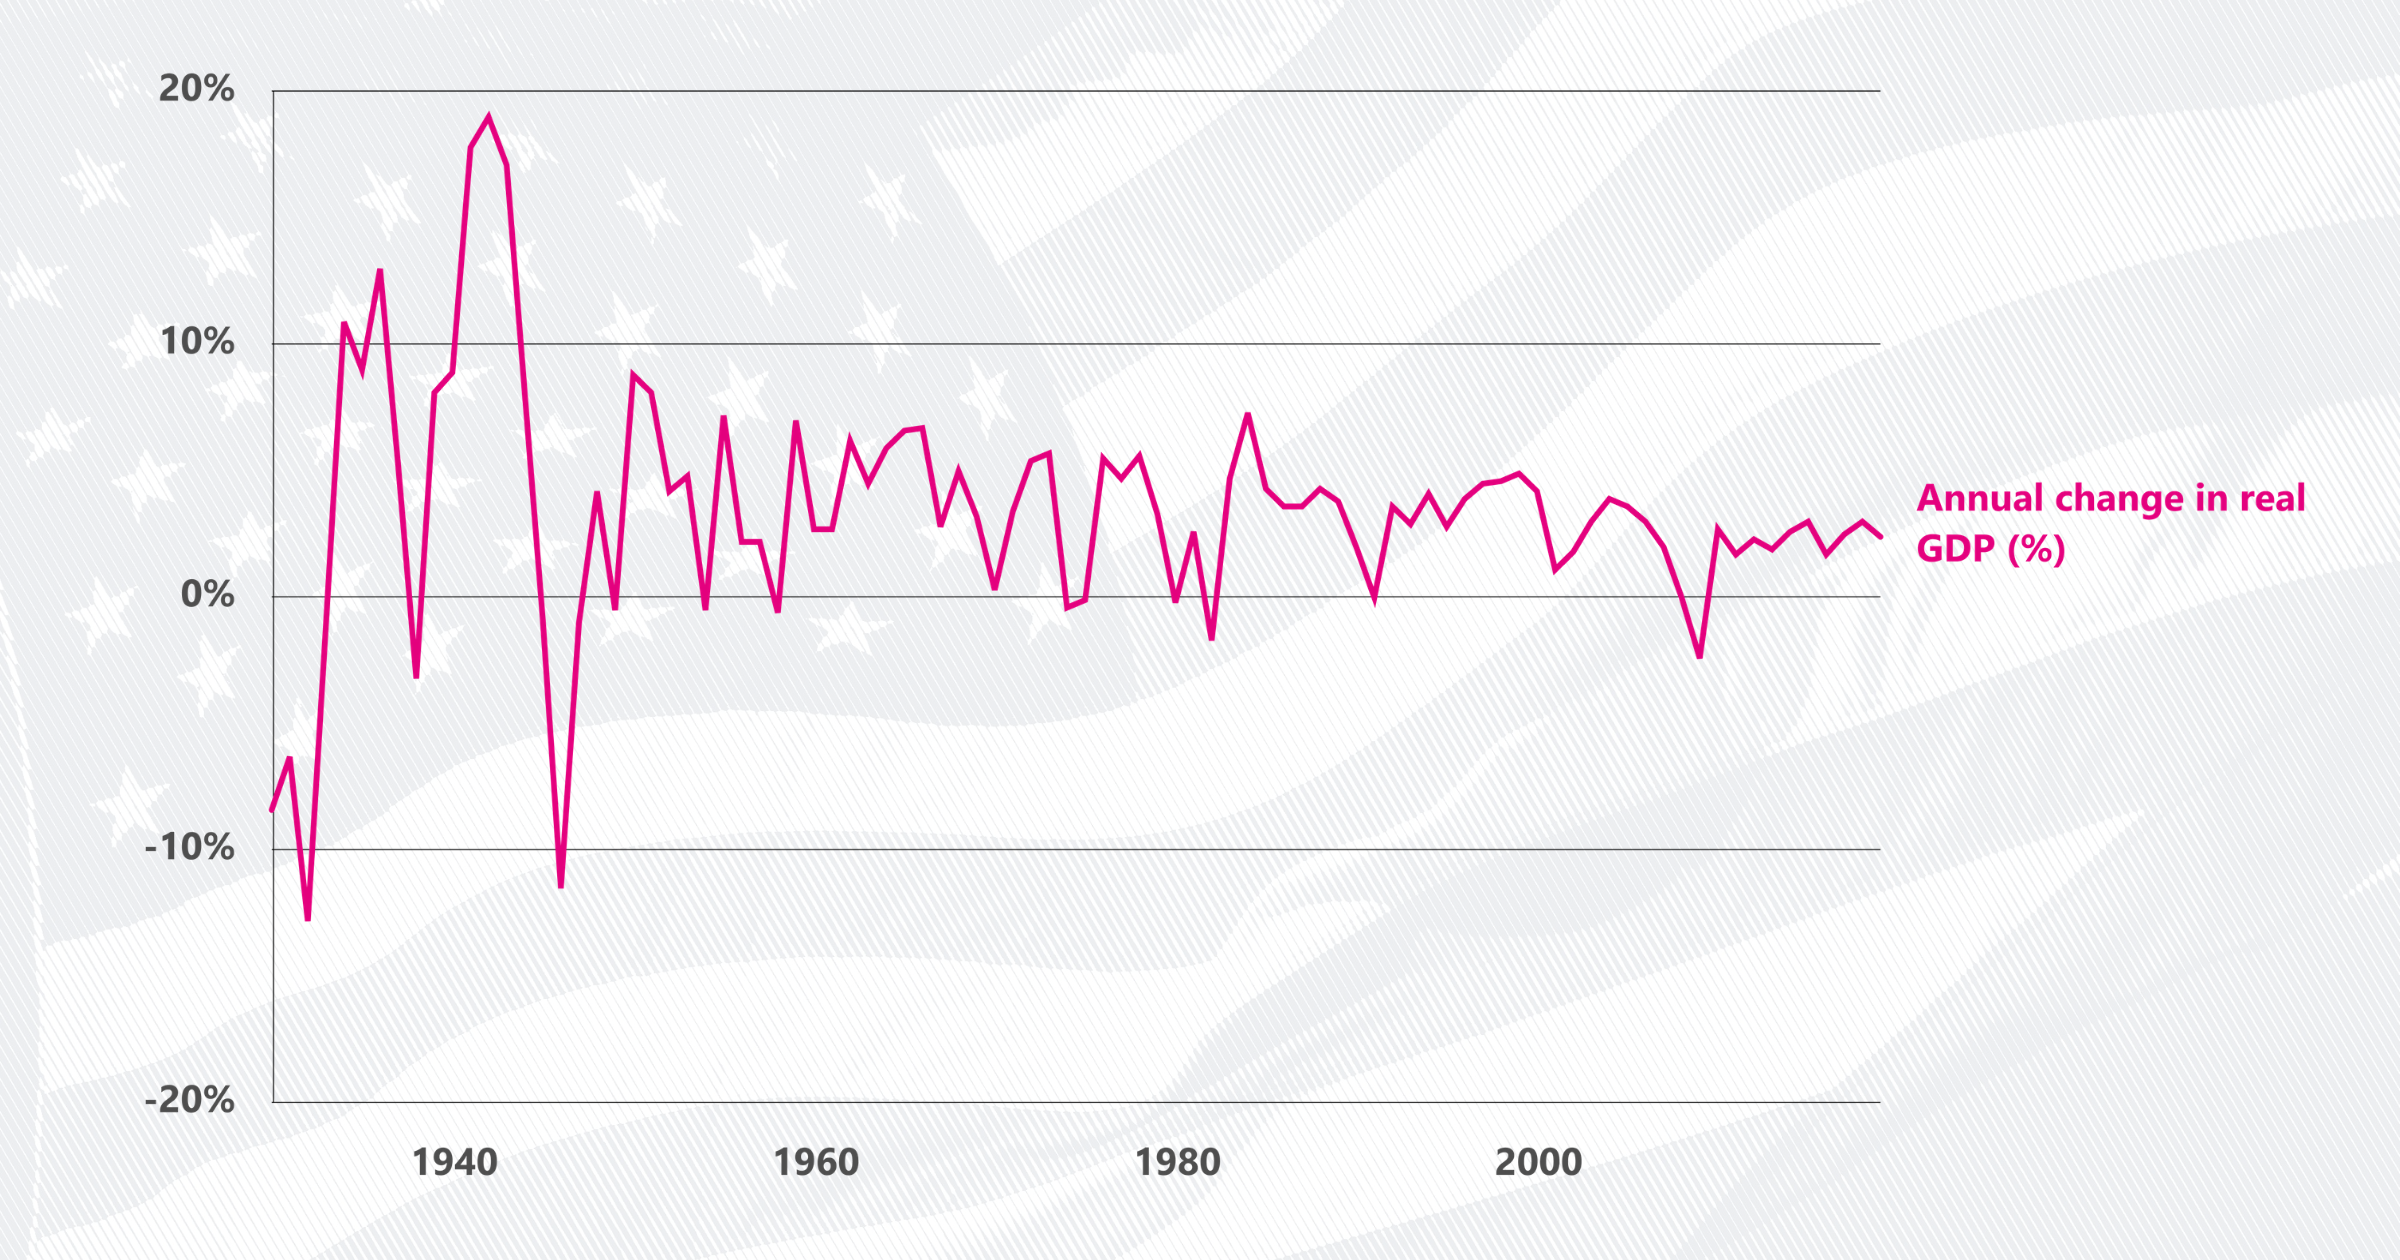
What is GDP and why is it such an important number?
Since the Great Depression, the federal government has played a role in aiding the nation’s farms through subsidies, including direct payments, crop insurance, and loans.
Government payments (excluding crop insurance payments) to farms have fluctuated since 1933, from a low of $1.5 billion in 1949 to $32.1 billion in 2000. In 1949, government payments made up 1.4% of total net farm income — a measure of profit — while in 2000 government payments made up 45.8% of such profits.
In 2019, farms received $22.6 billion in government payments, representing 20.4% of $111.1 billion in profits.
At the center of many of these programs are two arms of the US Department of Agriculture: The Commodity Credit Corporation (CCC) and the Federal Crop Insurance Corporation (FCIC). The CCC aids farms and takes measures to control the prices of commodities. The FCIC works with private insurers to run the nation’s crop insurance system. Both came out of the Great Depression.
Both are also considered mandatory spending in terms of federal budget purposes, meaning their budgets are handled largely outside of the congressional appropriations process. The CCC can borrow up to $30 billion from the US Treasury for its programs that include its long-term programs created through legislation such as farm bills as well as the “Market Facilitation Program” in response to US-China tariffs implemented in early 2020. Appropriations are used to recoup losses the CCC incurs, allowing it to maintain its borrowing ability from the Treasury.
Between 1996 and 2014, the CCC had a direct payment program for farms regardless of how much of a crop is produced. The 2014 farm bill changed how the CCC provided its subsidies, repealing a direct payment system that was based on historical yields but didn’t consider if the producer actually had losses in a given year. The 2014 bill required farmers of a set of crops to choose between two types of subsidy payments: Agriculture Risk Coverage (ARC), where payments are based on a commodity’s yield and potential revenue losses, or Price Loss Coverage (PLC), where payments are made to protect against price decreases. The two programs accounted for 60.8% of CCC’s government payments in 2017. (Conservation programs accounted for about a third.)
The CCC also provides loans known as marketing assistance loans (MAL) that allow producers to use their commodities as collateral. In some cases, producers may repay their loan at less than the loan principal, known as marketing loan gains (MLG), while others who qualify for a loan and choose not to take one may receive direct payments, or loan deficiency payments (LDP). These two programs are limited to producers making less than $900,000. In 2017, the CCC gave out a net total of $11.9 million of these types of payments, though it gave out $10.4 billion in 2000.
The FCIC works with private insurers to provide federal crop insurance. In 2019, 380 million acres of cropland were covered by federal crop insurance. The federal government also pays a portion of the premiums for the policies, covering 63% of the $10.1 billion in premiums in 2019.
Based on a required annual report filed with the World Trade Organization, the federal government gave farms $9.5 billion in subsidies tied specifically to the type of product. Corn growers received the most product-specific assistance with $2.2 billion in subsidies. That was only about 4.4% of the $50.4 billion in total corn production that year. Soybeans rank second in subsidies. While the US soybean industry produced $41.3 billion worth of products in 2017, it received $1.6 billion in subsidies in 2016, representing 3.9% of production.
The US sugar industry produced $2.5 billion worth of product in 2017 and received $1.6 billion in subsidies, according to the report. The support amounted to 63.5% of the value of total production.
Learn more from USAFacts and get the data directly in your inbox by signing up for our newsletter.
Newsletter
Keep up with the latest data and most popular content.