Economy
These states received most of the $350 billion in CARES Act small business loans

Americans have filed at least 52 million unemployment insurance claims since March.
To support the newly unemployed, Congress passed the CARES Act, a $2 trillion federal package enacted to boost the economy. Under one provision, any employee who lost a job due to the pandemic would receive $600 in additional unemployment insurance, on top of state-administered unemployment compensation.
According to the House Committee on Ways & Means, which introduced the CARES Act, the initial intention behind the $600 was to replace 100% of wages for the average worker. The median weekly pay for full-time workers was $957 in first quarter of 2020, according to the Bureau of Labor Statistics (BLS).
The provision is set to expire at the end of July and would return state unemployment programs to regular benefit levels, which differ throughout the country. Without the $600 per week increases, Florida, for instance, provides a maximum of $275 per week, while Massachusetts’s benefits top out at $1,234 weekly.
This impending loss of income for unemployed workers comes as eviction moratoriums throughout the country are ending, COVID-19 cases are rising, and unemployment remains near a record-high.
Intended to offset a loss of income from a job lost due to no fault of the employee, many families use unemployment insurance to help cover basic expenses, such as food, housing, and transportation. With the disparities in jobless benefits and cost of living across the country, families in different states are left with varying abilities to pay for these basic needs.
The average middle-class household (meaning the middle 20% of income earners) spends $4,311 per month, according to the BLS’s 2018 Consumer Expenditure Survey. The three largest expenses are food (13% or $580 per month), housing (35% or $1,488 per month), and transportation (17% or $720 per month). These expenses total 65% of consumer spending and do not include healthcare, education, or putting funds into savings. Without the additional $600, even the maximum unemployment insurance is unable to cover such expenses in any state.
Plus, costs of necessities, especially rent, vary greatly within states. Using the Department of Housing and Urban Development’s fair market rent data — determined by the cost of rents plus utilities slightly below the median of recent movers — it is apparent that the financial impact of unemployment benefits varies by location. In 26 states, the monthly state unemployment insurance is not enough to cover the fair market rent for a two-bedroom apartment and average middle-class spending for food and transportation in any county.
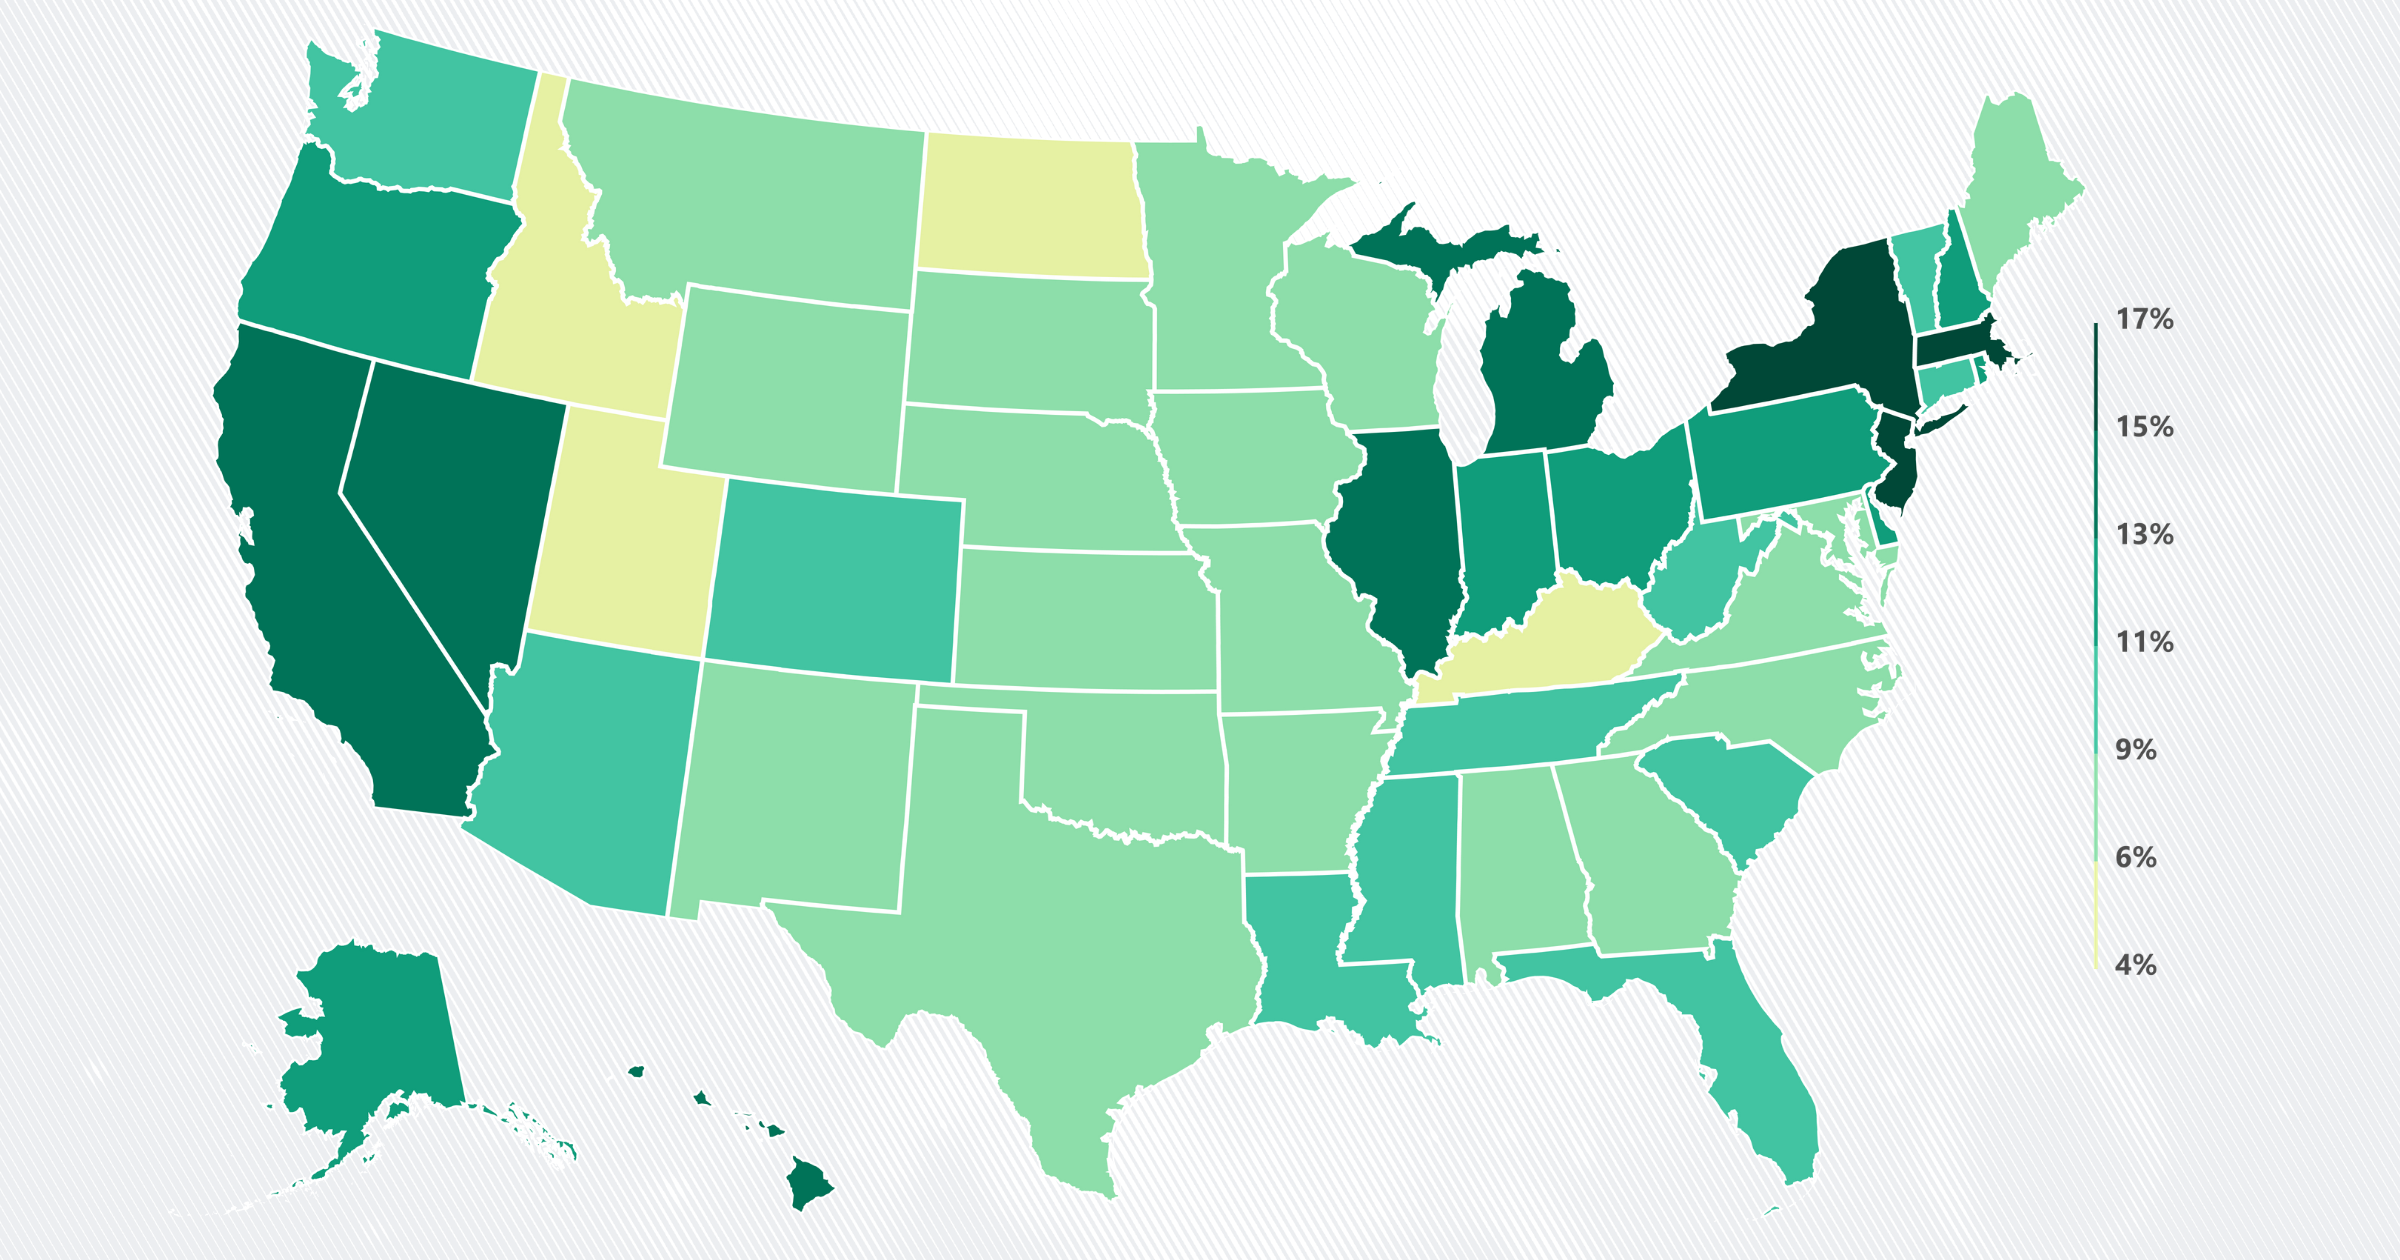
These figures only reflect those receiving the maximum unemployment insurance benefits; many American households only receive partial unemployment benefits. According to the Congressional Budget Office (CBO), about 17% of people in the bottom 20% of household income will receive benefits, a larger share than in other earnings groups. These workers are also the least likely to receive maximum unemployment benefits, which are calculated as a percentage of a worker’s lost earnings. In Oregon, for instance, only workers making at least $51,840 annually receive the maximum unemployment benefits.
The nation’s largest metro areas tend to have higher costs of living and people living there may find unemployment benefits inadequate. Of the 19 metro areas for which there is data from the Consumer Expenditure Survey, the maximum insurance only covers the average housing, transportation, and food spending in the Boston area, due to Massachusetts’s generous unemployment benefits.
While not everyone out of work receives unemployment insurance, a large share of Americans received the benefit this year. According to the CBO, 12% of the labor force and 76% of everyone unemployed received benefits in July.
For more information on jobs and income, check out USAFacts' employment dashboard for detailed geographic data on monthly employment numbers and our COVID-19 Impact and Recovery hub for real-time data on the nation's economic recovery. Learn more from USAFacts and get the data directly in your inbox by signing up for our newsletter.
Economy
Economy
Economy
Economy
Newsletter
Keep up with the latest data and most popular content.