Health
The Affordable Care Act and the data: Who is insured and who isn't

Cancer has been one of the top two leading causes of death in the United States for over 75 years. According to the National Cancer Institute (NCI), nearly 40% of all Americans will be diagnosed with cancer at some point in their lives.[1]
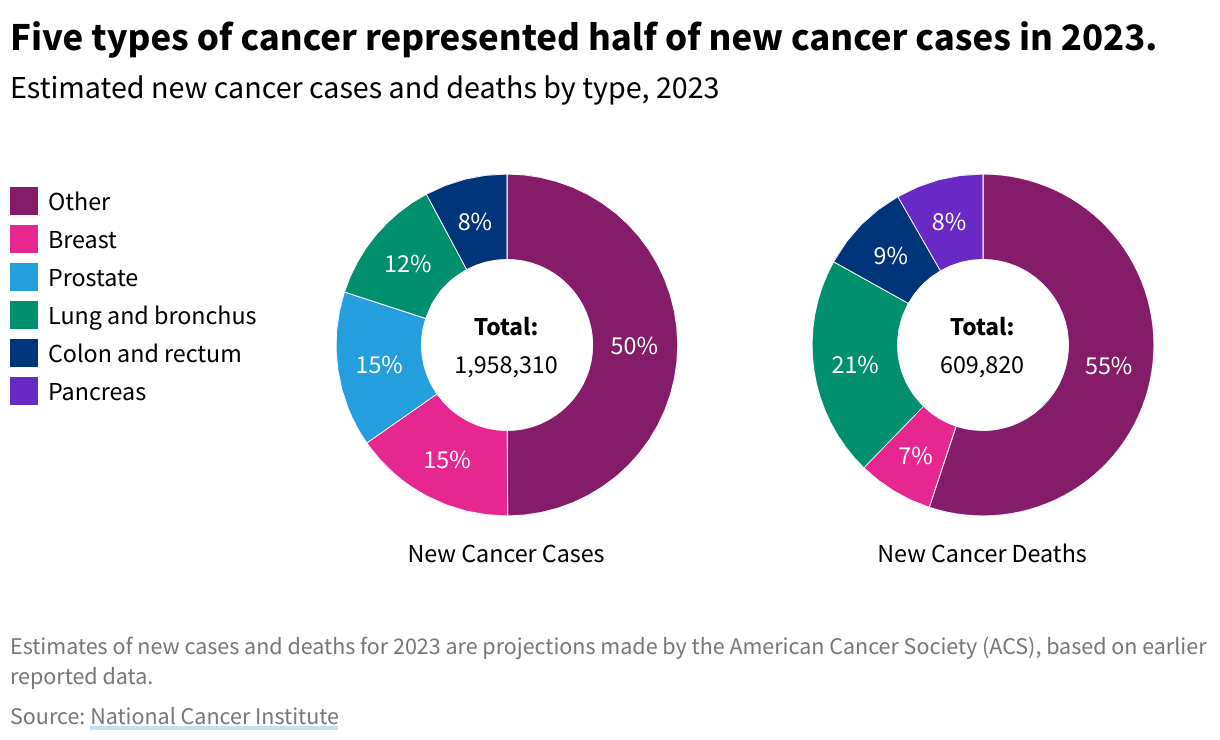
According to NCI data, 2023 could have approximately 1.96 million new cancer cases. It projects over 609,000 people could die from cancer.
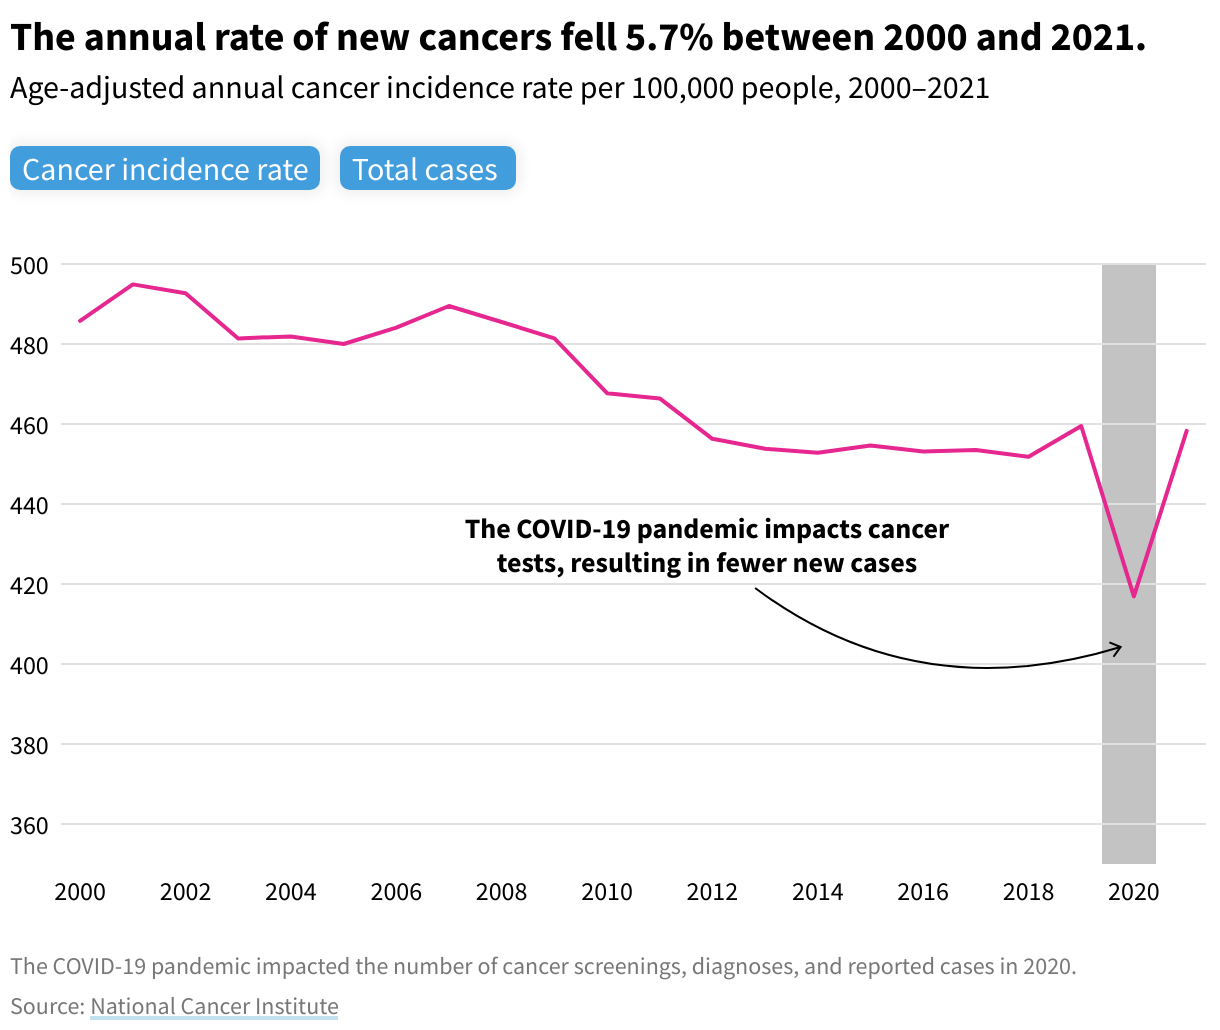
However, even though the overall number of cases rises as the population grows, fewer people are getting and dying from cancer. Between 2000 and 2019, the incidence rate — or the rate of new cancer cases per 100,000 people — declined by 5.4%, while the annual mortality rate fell by more than 26%.
In 2019, age-adjusted figures show 460 new cancer cases and 146 deaths per 100,000 individuals.
As of January 2022, an estimated 18.1 million cancer survivors were in the United States. That’s approximately 5.4% of the population.
There are some disparities in cancer rates across different population demographics. As of 2020, Black and Indigenous Americans are more likely than any other racial demographic to die from the disease.
However, age is still the most indicative cancer risk factor for all racial and ethnic groups.
Cancer rates also vary between states due to differing local risk factors.
Between 2000 and 2019, annual cancer cases increased 36.5%. The number of new cancer cases annually rose from 1.3 million to 1.8 million, growing consistently nearly every year. New recorded cancer cases fell in 2020 to 1.6 million, likely due to fewer screenings and diagnoses since the COVID-19 pandemic made it harder for patients to access these services.
As new cancer cases have increased, so have deaths. Between 2000 and 2019, cancer deaths grew from approximately 550,000 to just under 600,000. That’s up 8.4%, less than the 36.5 % increase in new cancer cases over the same period, indicating that improved screening and treatment techniques can help improve survival rates..
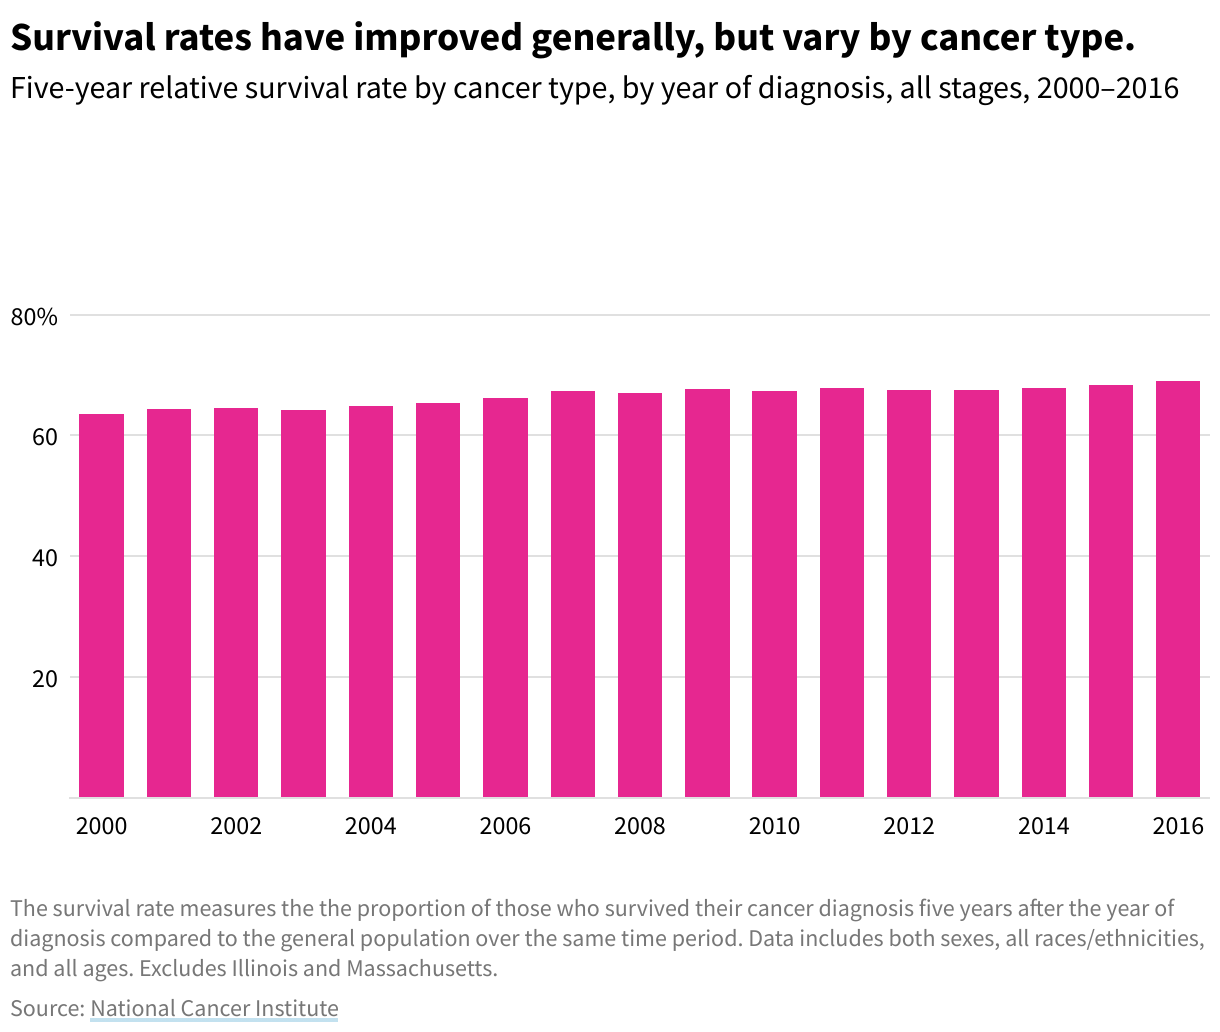
Cancer survival rates indicate the proportion of patients who live a certain amount of time after their diagnosis.
The five-year relative survival rate, a key measure, shows the percentage of patients alive five years after diagnosis, adjusted for other causes of death. It compares the survival of cancer patients to that of a similar group without cancer, isolating cancer as the sole cause of death.
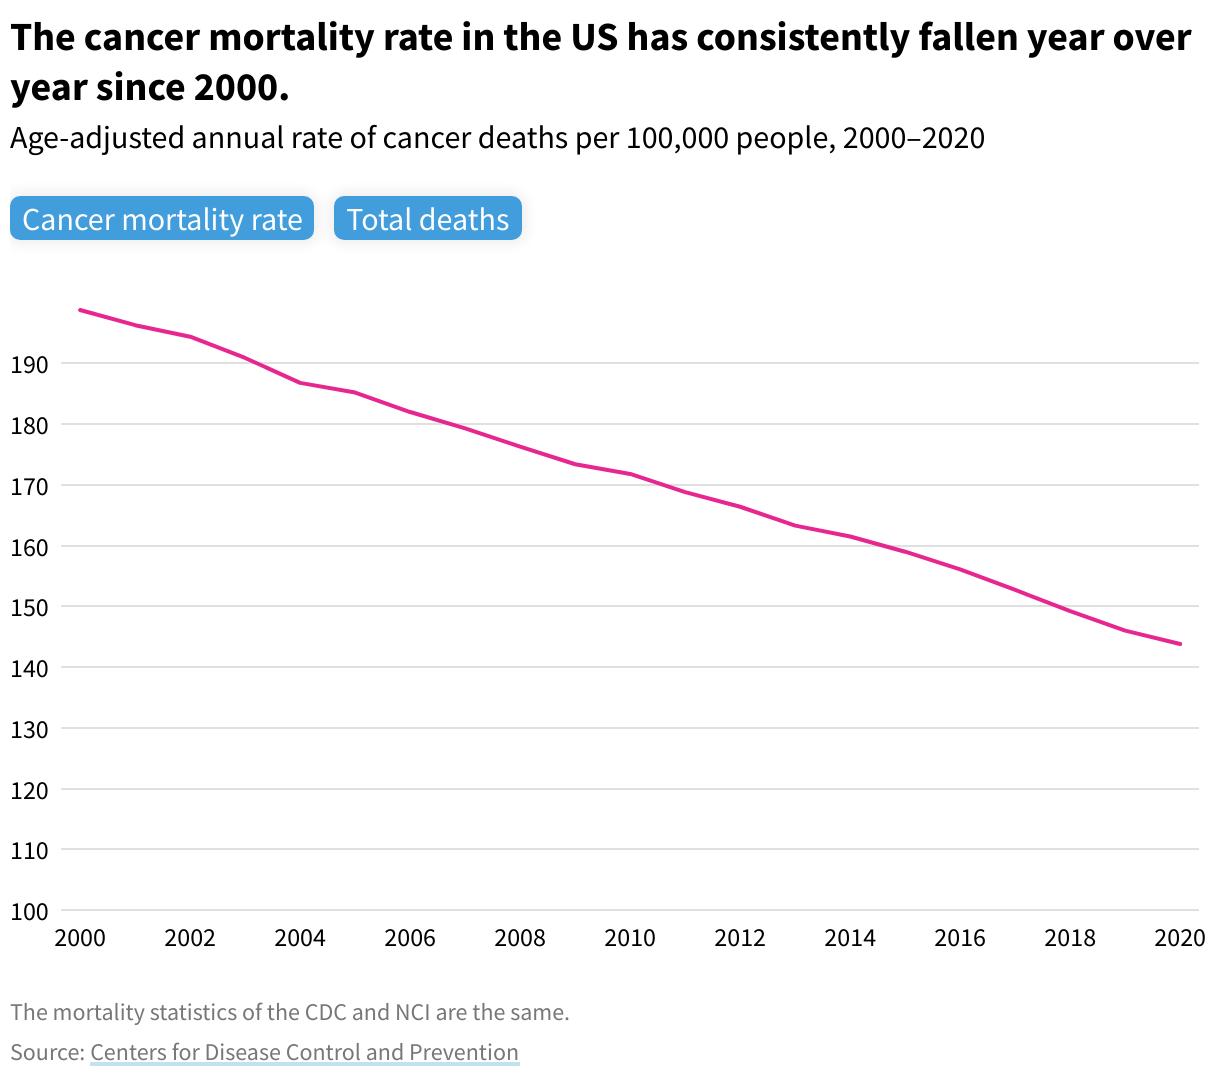
According to the National Institutes of Health, "improvements in preventing, detecting, and treating cancer” have contributed to a two-decade-long trend in declining cancer mortality rates.
While the overall cancer cases and deaths have risen along with the US population, the incidence and mortality rates are declining.
According to CDC data, the number of new cancer cases nationwide rose nearly 36.5% between 2000 and 2019. Meanwhile, the age-adjusted incidence rate per 100,000 people fell from 485.8 to 459.5, a 5.4% drop.[2]
This trend is underscored by annual cancer deaths. While total cancer deaths grew by 8.4% between 2000 and 2019, the annual mortality rate fell from 198.8 to 146.0 per 100,000 people — a 26.6% decline.
Similarly, the five-year relative survival rate for patients increased from 63.5% in 2000 to 68.4% in 2015. Models show it’s still increasing.
You are signed up for the facts!
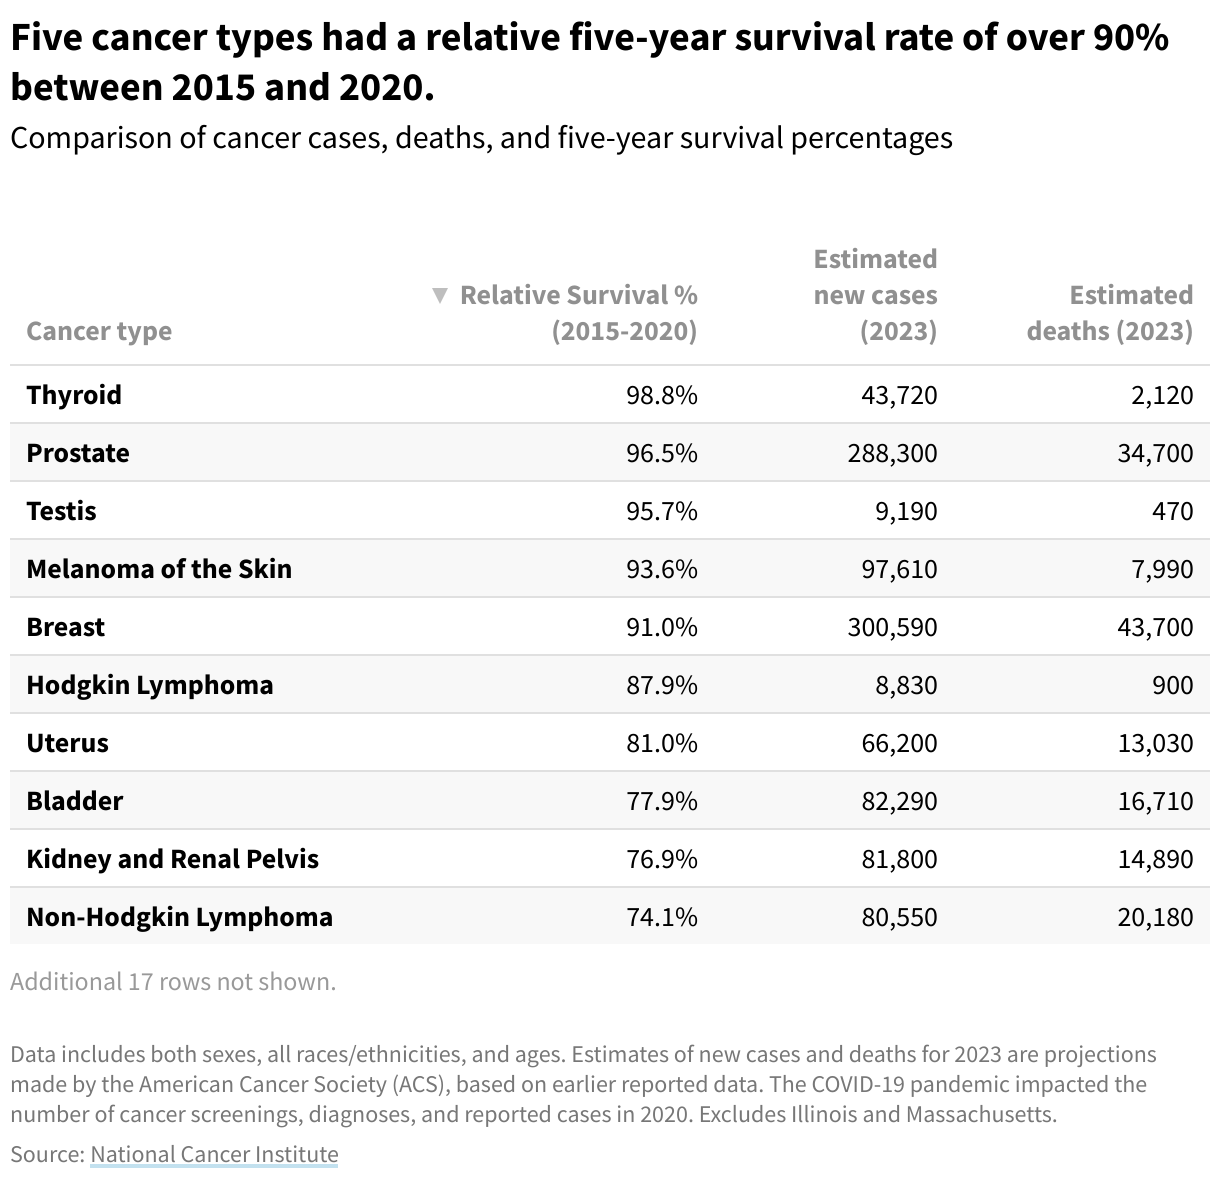
Breast, prostate, and lung cancers were the most common new cases among the 1.96 million new cancer cases nationwide in 2023. Lung cancer, colon cancer, and pancreatic cancer were responsible for the greatest shares of the more than 600,000 cancer deaths.
However, mortality and survival rates vary depending on the type of cancer.
For instance, while the National Institutes of Health (NIH) estimates that breast cancer caused the fourth-highest number of cancer-related deaths in 2023, it had the fifth-highest relative survival rate between 2015–2020.
By contrast, esophageal cancer made up approximately 2.6% of new cases in 2023, but had one of the lowest relative survival rates between 2015–2020.
Other factors, such as sex, race, ethnicity, and age, can lead to differences in cancer risk among groups of people due to genetics, environmental factors, and more.
It should be noted that estimated cancer deaths in 2023 do not reflect the five-year survival rate between 2015 and 2020, as deaths in 2023 may result from cancer cases diagnosed prior to the five-year window.
In 2019, men had higher rates of both new cancer diagnoses and cancer-related deaths than women.
Specifically, the incidence rate for men was 499.6 per 100,000 men, which is about 15.4% higher than the 433 cases per 100,000 women. Additionally, the cancer death rate for men was 173.1 per 100,000, which is 37.5% higher than the 125.9 per 100,000 rate for women.
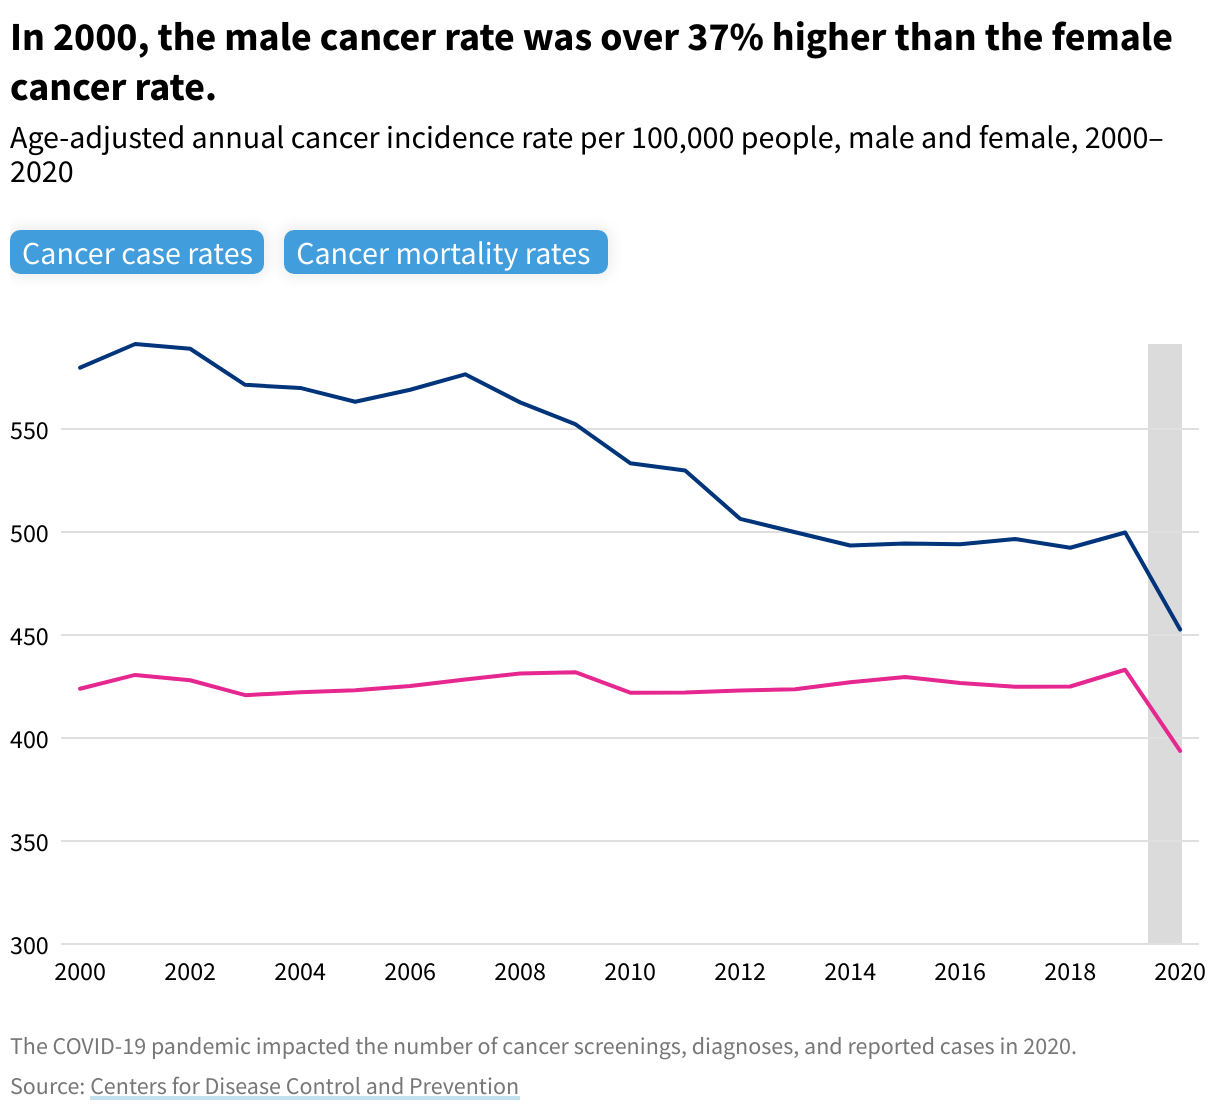
Between 2000 and 2008, the incidence rate for men was over 30% higher than for women. But, beginning in 2007, this gap started to close, in part due to a decline in prostate cancer incidences.
Estimates for 2023 point to prostate, lung, and colon/rectal cancers as the most common for men, comprising 50.8% of new cancer cases and 45.9% on cancer deaths. For women, the most common cancers are estimated to be breast, lung, and colon/rectal cancers, which accounted for 54.6% of their new cancer cases and 50.1% of cancer deaths in 2023.
According to 2019 NCI data, non-Hispanic, white Americans had the highest incidence rate of new cancers at 493.4 cases per 100,000 people, followed by non-Hispanic, Black Americans at a rate of 479.5. However, non-Hispanic Black Americans had the highest cancer mortality rate at 171.4 per 100,000 people — 13.6% higher than their white counterparts. Non-Hispanic Asian/Pacific Islander Americans had both the lowest incidence and mortality rate at 324.6 and 92.4 cases per 100,000 people, respectively.
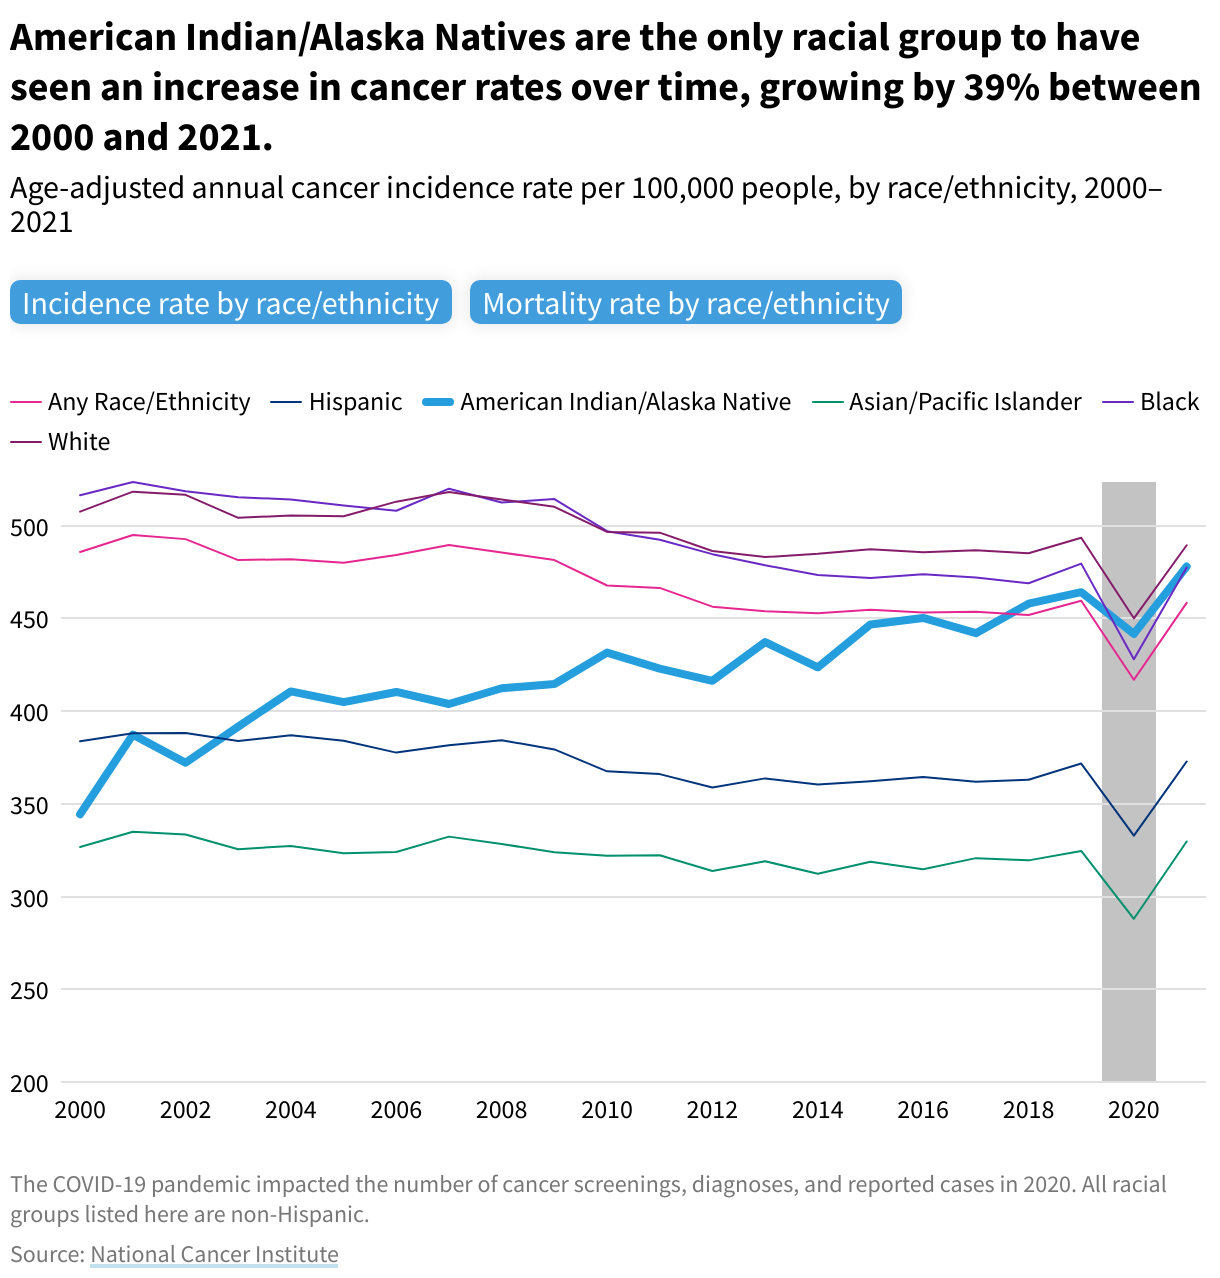
When also accounting for race and ethnicity, non-Hispanic, American Indian/Alaska Native people had an increased cancer incidence rate. Between 2000 and 2019, the rate increased from the prior year in 13 of 19 years, despite mostly decreasing year over year for every other measured racial and ethnic group.
Comparing only rates from 2000 and 2019, incidence rates dropped for every other measured racial and ethnic group, while they rose by nearly 35% for American Indian/Alaska Native people.
While the reason behind these disparities is hard to pin down, contributing factors include access to healthcare, environmental conditions, lifestyle behaviors, and genetics.
Differing cancer risks and outcomes are called cancer health disparities, and the NIH says these are driven by a lack of healthcare coverage and low socioeconomic status, which is based on income, education, and other variables. These directly impact a person’s ability to access health care and also influence behaviors, such as smoking, that increase cancer risk.
Advancing age is a decisive cancer risk factor. The incidence rate steadily grows as age increases, with data from 2019 showing 17.1 cases per 100,000 people under 15, 560.7 cases per 100,000 adults ages 40-64, to more than 2,200 cases per 100,000 adults 75 and older.
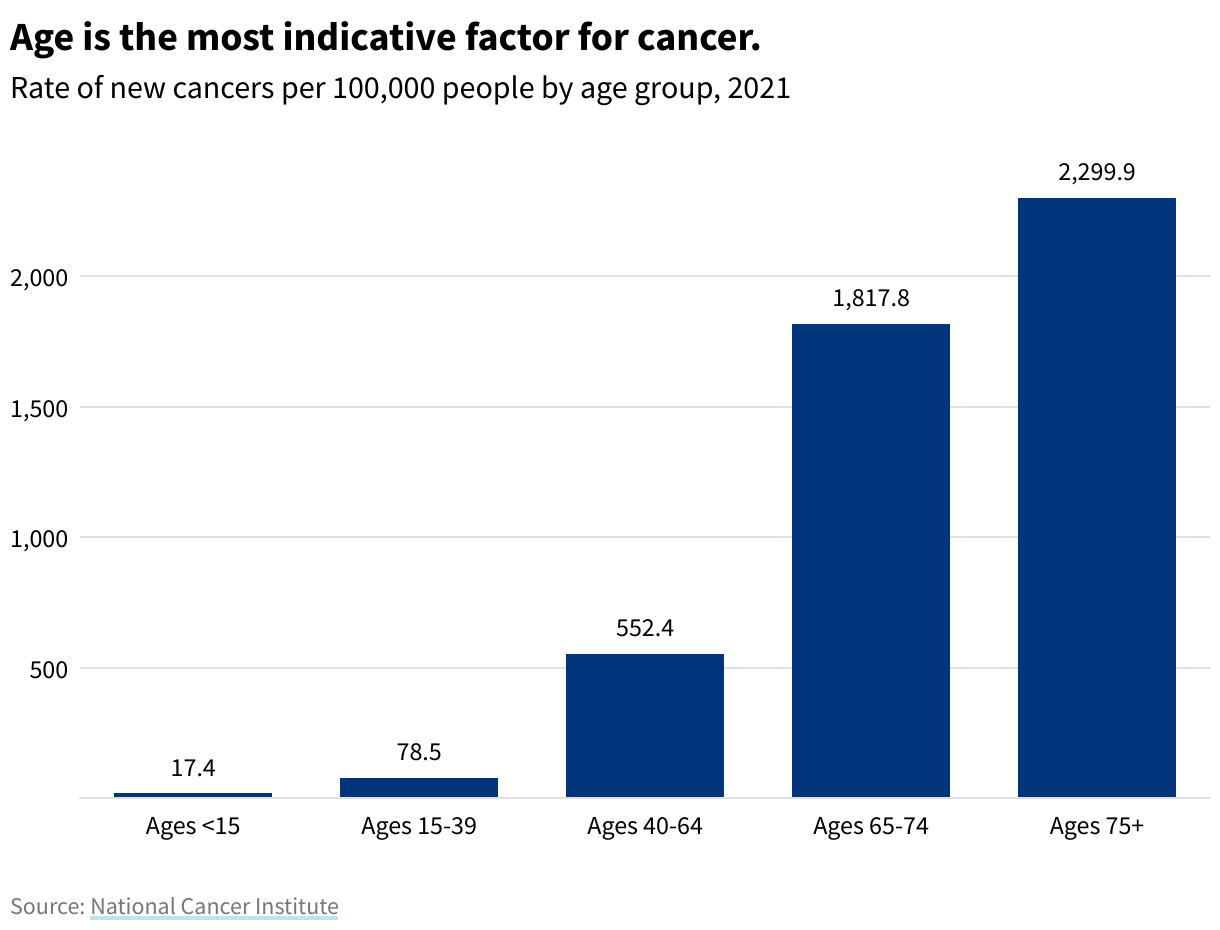
According to NCI data from 2016 to 2020, the median age of cancer diagnosis is 66, while the median age of death is 72. But patients can get a diagnosis at any age, and certain cancers may be more prevalent among specific ages. Early cancer screenings can diagnose potential diseases, helping to lower mortality rates over time, as is the case for prostate cancer mortality rate which has dropped by 39% from 30.4 to 18.4 deaths per 100,000 people between 2000 and 2019.
We rely on SEER statistics as our primary source of information on cancer incidence and survival in the United States, considering it authoritative in this field. SEER employs sampling and statistical analysis, covering approximately 48% of the US population through its cancer registries, to provide insights into cancer incidence nationwide. While SEER provides raw data to certain researchers for independent analysis, we adhere to the information they choose to publish.
However, SEER does not publish the total number of new cancer cases per year; instead, it reports rates per 100,000 people. Consequently, USAFacts uses alternative sources to determine the annual number of cancer cases. The CDC utilizes SEER's raw data along with that from the National Program of Cancer Registries and the CDC's National Vital Statistics System to create the US Cancer Statistics Data Visualizations Tool, which offers a comprehensive analysis, including the total number of cancer cases per year.
While both SEER and the CDC publish cancer incidence rates per 100,000 people, we cite SEER due to its authoritative status. These rates may exhibit slight discrepancies because each organization employs different methodologies to extrapolate total cases from sampled populations.
Regarding mortality data, we at USAFacts typically reference SEER, but these figures originate from the National Center for Health Statistics (NCHS). Both the CDC and SEER utilize NCHS statistics for mortality reporting, ensuring estimate consistency.
Learn more about health in the US, including changing mortality rates, and get data directly in your inbox by signing up for our newsletter.