Population and society
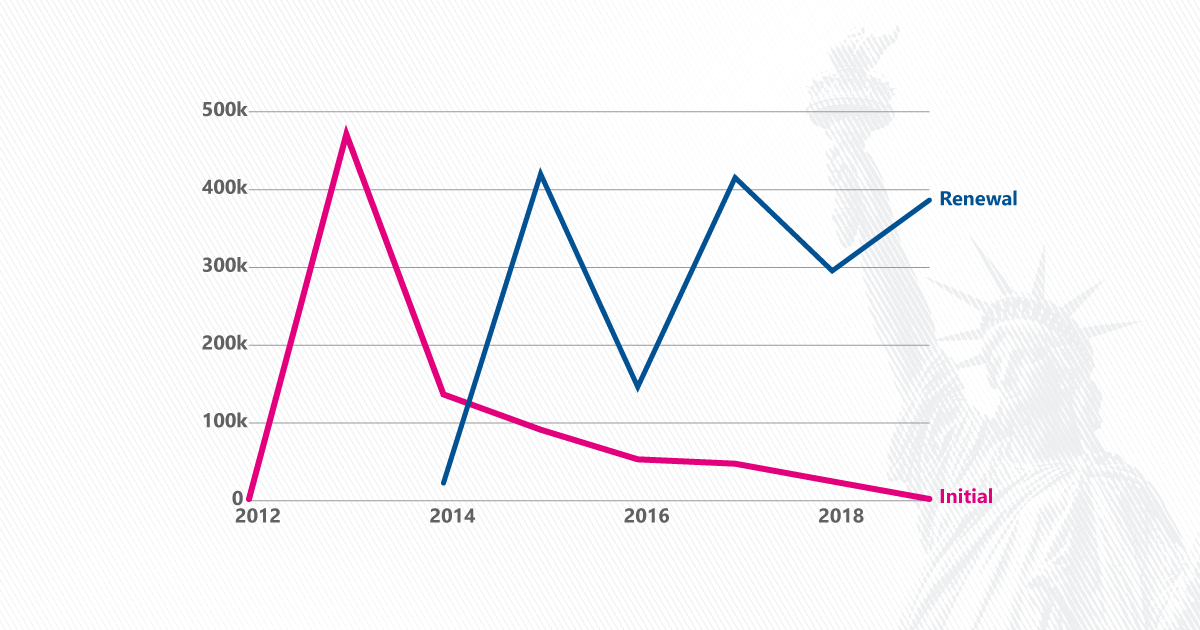
Asylum in the United States: How the case backlog grew to hundreds of thousands
During the pandemic, the number of jobs available grew, the number of people getting educated fell, and spending on things such as recreation and hotel stays plummeted. Here are eight charts showing some of the ways the pandemic reverberated in different realms of American life.
In February 2020, the Bureau of Labor Statistics estimated there were 7 million job openings. There were 23% more job openings than people who were unemployed.
In February 2022, there were 11.3 million job openings. For every unemployed person, there were almost two job openings.
In February 2020, 3.4 million people quit their jobs, making up 60% of all people who had a job separation. [1]
When the pandemic hit, the trend veered in the opposite direction. In April 2020, 2 million people quit their jobs, an 8-year low. Quits made up 18% of job separations that month.
It is unknown what would have happened to the trend if the pandemic didn’t occur. But two years into the pandemic, quit rates are at a 22-year high. April 2022 data shows that 4.4 million people quit their jobs, making up 73% of all separations.
In February 2020, before the pandemic struck, 63.4 out of every 100 working-age people had or were looking for jobs. That rate is known as the labor force participation rate.
Two months later, that rate fell to 60.2 percent, the lowest level since 1971. Since then, the rate climbed to 62.2.
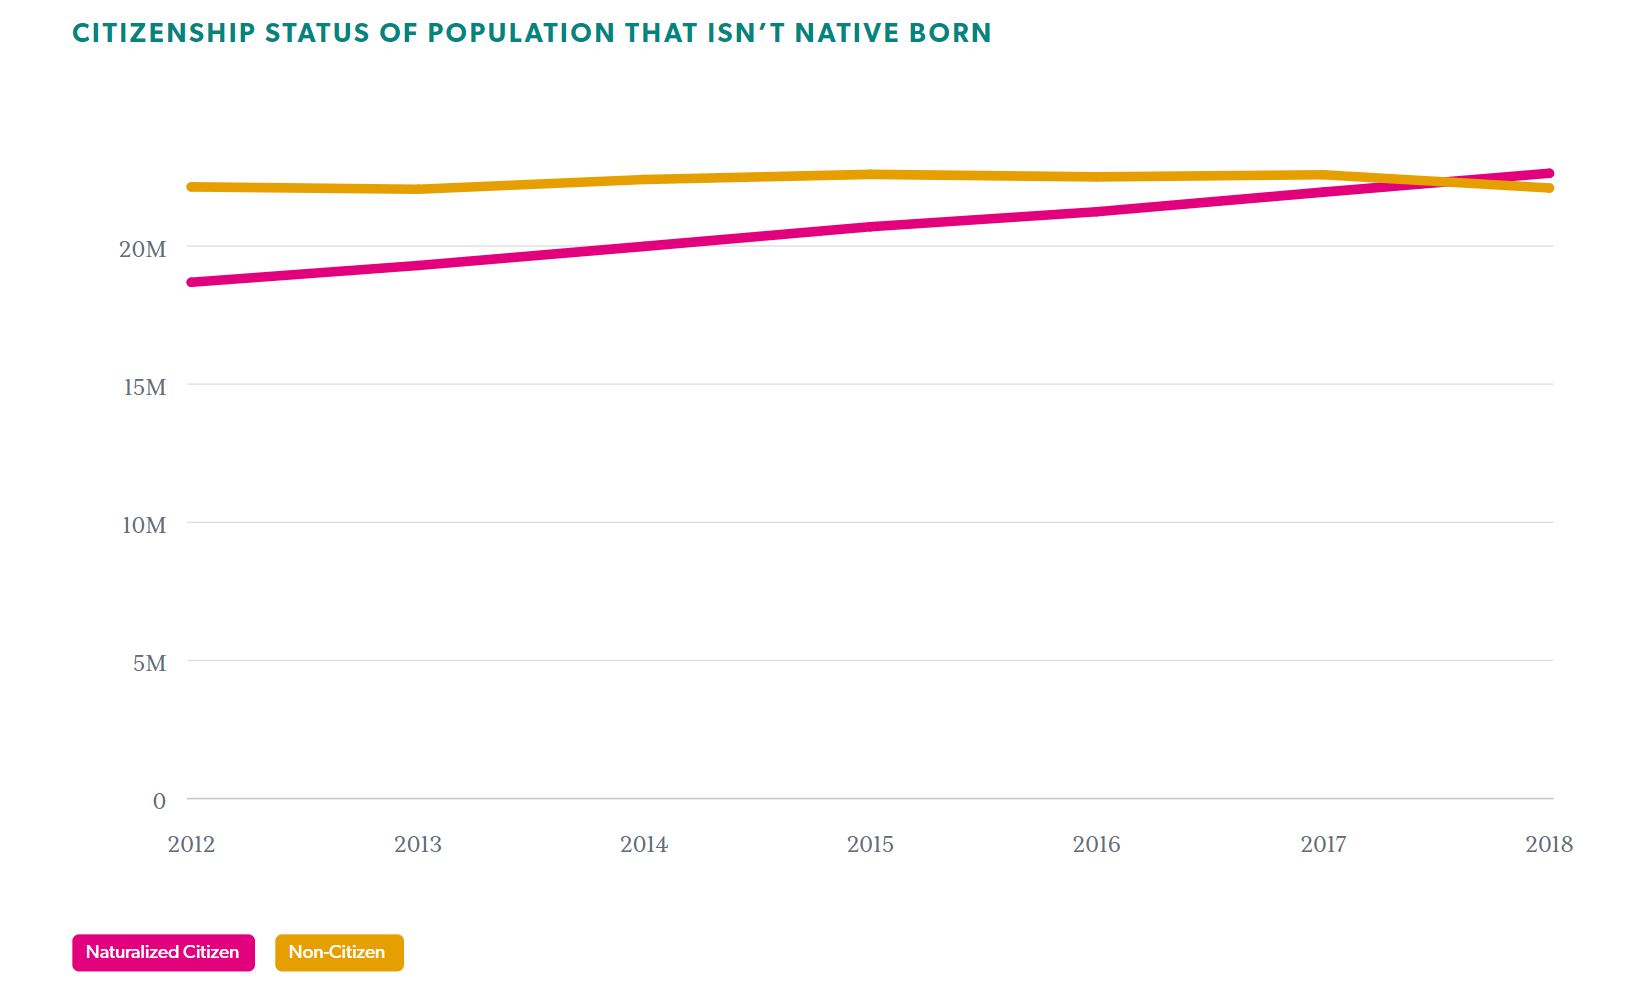
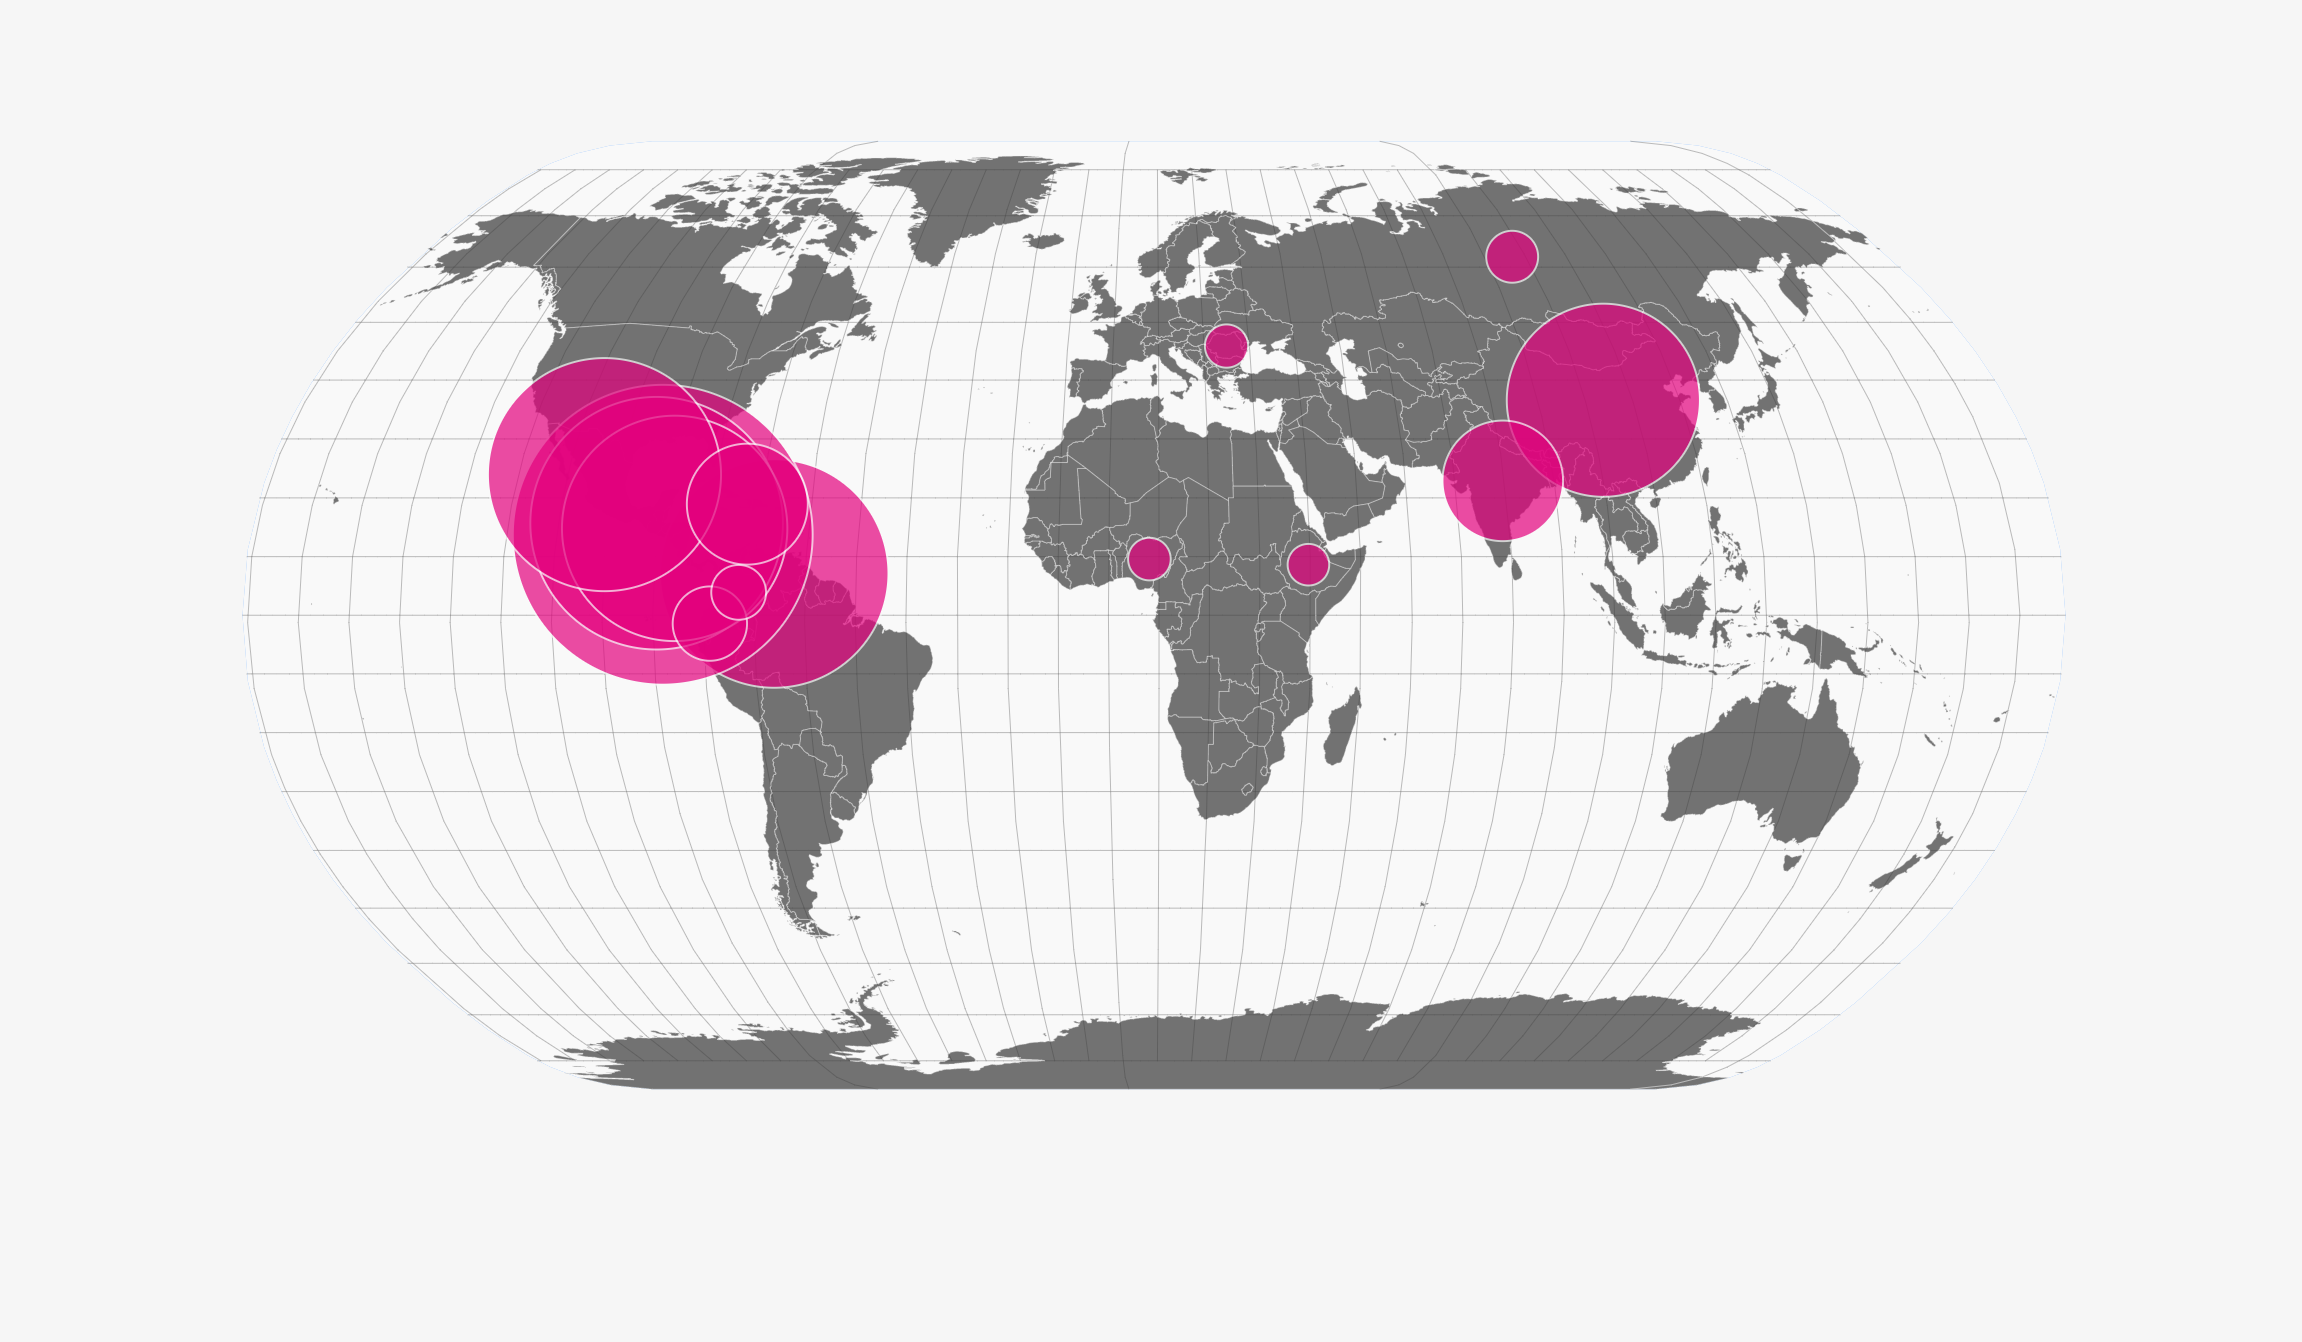
Nearly every measure of immigration shows that fewer people came to the US from foreign countries since the pandemic. COVID-19 rules led the State Department to issue 38% fewer immigrant visas and 68% fewer non-immigrant visas in 2021 compared with 2019. Additionally, COVID-19 regulations made it more difficult for migrants to receive asylum.
Between fall 2019 and fall 2020, undergraduate enrollment at postsecondary institutions of any type dropped 4%, from 16.5 million to 15.9 million. The Department of Education has not released enrollment data for fall 2021.
The number of public school students dropped 3% between fall 2019 and fall 2020. The dip is most pronounced among three- to five-year-old children. In fall 2019, 66% of the group enrolled in public schools. In fall 2020, that number dropped to 55%.
In 2020, the Energy Information Administration conducted a survey that included questions regarding streaming video at home. Fifty-six percent of households reported streaming on at least one device in the home. That is up from about 29% who said the same thing in the last version of the survey in 2015.
Since the trend toward streaming options versus broadcast or cable began before 2020, it’s difficult to determine how much of the shift was accelerated due to the pandemic.
During the first quarter of 2020, Americans spent $75.6 billion (in 2020 dollars) on arts, entertainment, and recreation. That spending dropped by nearly half to $37.6 billion three months later.
Fast forward to the present, and the average spending over the last two quarters was 17% higher than the pre-pandemic numbers.
The accommodation industry, which includes hotels and resorts, experienced a 62% decline in revenue from $64.3 billion to $24.4 billion between the first and second quarters of 2020. Since then, the industry has rebounded to historic highs[2], hitting $79.6 billion in the final quarter of 2021.
Learn more from USAFacts and get the data directly in your inbox by signing up for our newsletter.
Population and society
Population and society
Population and society
Population and society
Newsletter
Keep up with the latest data and most popular content.